. 2024 May 29;25(11):5937.
doi: 10.3390/ijms25115937.

T Cell Homeostasis Disturbances in a Cohort of Long-Term Elite Controllers of HIV Infection

Affiliations

T Cell Homeostasis Disturbances in a Cohort of Long-Term Elite Controllers of HIV Infection

José M Benito et al. Int J Mol Sci. .

Abstract

Elite controllers (ECs) are people living with HIV (PLWH) able to control HIV replication without antiretroviral therapy and have been proposed as a model of a functional HIV cure. Much evidence suggests that this spontaneous control of HIV has a cost in terms of T cell homeostasis alterations. We performed a deep phenotypic study to obtain insight into T cell homeostasis disturbances in ECs maintaining long-term virologic and immunologic control of HIV (long-term elite controllers; LTECs). Forty-seven PLWH were included: 22 LTECs, 15 non-controllers under successful antiretroviral therapy (onART), and 10 non-controllers not receiving ART (offART). Twenty uninfected participants (UCs) were included as a reference. T cell homeostasis was analyzed by spectral flow cytometry and data were analyzed using dimensionality reduction and clustering using R software v3.3.2. Dimensionality reduction and clustering yielded 57 and 54 different CD4 and CD8 T cell clusters, respectively. The offART group showed the highest perturbation of T cell homeostasis, with 18 CD4 clusters and 15 CD8 clusters significantly different from those of UCs. Most of these alterations were reverted in the onART group. Interestingly, LTECs presented several disturbances of T cell homeostasis with 15 CD4 clusters and 13 CD8 clusters different from UC. Moreover, there was a specific profile of T cell homeostasis alterations associated with LTECs, characterized by increases in clusters of naïve T cells, increases in clusters of non-senescent effector CD8 cells, and increases in clusters of central memory CD4 cells. These results demonstrate that, compared to ART-mediated control of HIV, the spontaneous control of HIV is associated with several disturbances in CD4 and CD8 T cell homeostasis. These alterations could be related to the existence of a potent and efficient virus-specific T cell response, and to the ability to halt disease progression by maintaining an adequate pool of CD4 T cells.

Keywords: HIV control; T cell homeostasis; immunology; long-term elite controllers (LTECs).


Conflict of interest statement

Author José M. Ligos was employed by Cytek Biosciences. The remaining authors declare that the research was conducted in the absence of any commercial or financial relationships that could be construed as a potential conflict of interest.

Figures

Figure 1
Figure 1
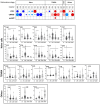
The upper graph of the figure shows a schematic representation (bubble diagram) of CD4 T cell clusters, with significant differences between the PLWH groups and the UC group. Clusters are grouped according to maturation stage (defined by CD45RA and CCR7 markers). Each bubble in the diagram represents a significant difference with respect to the UC group. The size of the bubble (from the smallest to the biggest size) indicates the degree of difference in fold-change: <2, 2–3, 3–4, 4–5, and >5. Red colors indicate an increase and blue colors indicate a decrease with respect to the UC group. The level of statistical significance (corrected p-value) is indicated by the color tone: 0.05–0.01, 0.01–0.001, and <0.001 for the light, medium, and dark tones, respectively. The lower graphs of the figure show violin plot graphs of the levels (expressed as a percentage of total CD4 T cells) of each cluster in the four study groups. As in the upper graph, clusters are grouped according to maturation stage. In each violin plot graph, bars inside the plots indicate those PLWH groups that showed a statistically significant difference with respect to the UC group.
Figure 2
Figure 2
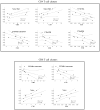
The upper graph of the figure shows a schematic representation (bubble diagram) of CD8 T cell clusters, with significant differences between the PLWH groups and the UC group. Clusters are grouped according to maturation stage (defined by CD45RA and CCR7 markers). Each bubble in the diagram represents a significant difference with respect to the UC group. The size of the bubble (from the smallest to the biggest size) indicates the degree of difference in fold-change: <2, 2–3, 3–4, 4–5, and >5. Red colors indicate an increase and blue colors indicate a decrease with respect to the UC group. The level of statistical significance (corrected p-value) is indicated by the color tone: 0.05–0.01, 0.01–0.001, and <0.001 for the light, medium, and dark tones, respectively. The lower graphs of the figure show violin plot graphs of the levels (expressed as a percentage of total CD8 T cells) of each cluster in the four study groups. As in the upper graph, clusters are grouped according to maturation stage. In each violin plot graph, bars inside the plots indicate those PLWH groups that showed a statistically significant difference with respect to the UC group.
Figure 3
Figure 3
Scatter plots showing correlations between HIV plasma viral load and levels of different clusters of CD4 (upper plots) or CD8 (lower plots) T cells. Correlations with plasma HIV load were analyzed in the offART group. In all plots, the x-axis represents the level of each cluster expressed as a percentage of total CD4 or CD8 T cells and the y-axis represents the HIV plasma viral load expressed as copies/mL (log scale). The Spearman’s Rho correlation coefficient and p-value are given inside each scatter plot and the legend over each plot describes the phenotype of cells forming that cluster.
Figure 4
Figure 4
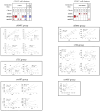
Schematic representation (bubble diagram) of bivariate correlations (Spearman rho coefficient) between CD4 (upper left diagram) or CD8 (upper right diagram) T cell clusters and CD4 counts in the different PLWH groups. Each bubble in the diagram represents a positive (red color) or negative (blue color) correlation. The size of the bubble (from the smallest to the biggest size) indicates the value of the Spearman rho coefficient: <0.5, 0.5–0.7, and >0.7. The level of statistical significance (p-value) is indicated by the color tone: 0.1–0.05, <0.05–0.01, and <0.01 for the light, medium, and dark tones, respectively. T cell clusters are grouped according to maturation stage. Below the diagrams, scatter plots of correlations between CD4 counts (y-axis on the plots) and the levels of different clusters of CD4 (left) and CD8 (right) T cells are shown. The Spesarman’s rho coefficient and p-value are given inside each scatter plot.

Similar articles

Cited by

References

    1. Autran B., Descours B., Avettand-Fenoel V., Rouzioux C. Elite controllers as a model of functional cure. Curr. Opin. HIV AIDS. 2011;6:181–187. doi: 10.1097/COH.0b013e328345a328. - DOI - PubMed
    1. Deeks S.G., Lewin S.R., Ross A.L., Ananworanich J., Benkirane M., Cannon P., Chomont N., Douek D., Lifson J.D., Lo Y.R., et al. International AIDS Society global scientific strategy: Towards an HIV cure 2016. Nat. Med. 2016;22:839–850. doi: 10.1038/nm.4108. - DOI - PMC - PubMed
    1. Kwaa A.K., Blankson J.N. Immune responses in controllers of HIV. Ann. Rev. Immunol. 2024;42:21–33. doi: 10.1146/annurev-immunol-083122-035233. - DOI - PubMed
    1. Betts M.R., Nason M.C., West S.M., De Rosa S.C., Migueles S.A., Abraham J., Lederman M.M., Benito J.M., Goepfert P.A., Connors M., et al. HIV nonprogressors preferentially maintain highly functional HIV-specific CD8+ T cells. Blood. 2006;107:4781–4789. doi: 10.1182/blood-2005-12-4818. - DOI - PMC - PubMed
    1. Ndhlovu Z.M., Stampouloglou E., Cesa K., Mavrothalassitis O., Alvino D.M., Li J.Z., Wilton S., Karel D., Piechocka-Trocha A., Chen H., et al. The Breadth of Expandable Memory CD8+ T Cells Inversely Correlates with Residual Viral Loads in HIV Elite Controllers. J. Virol. 2015;89:10735–10747. doi: 10.1128/JVI.01527-15. - DOI - PMC - PubMed