. 2024 May 29;25(11):5963.
doi: 10.3390/ijms25115963.

Anti-Inflammatory and Immunomodulatory Effects of 0.1 Sub-Terahertz Irradiation in Collagen-Induced Arthritis Mice

Affiliations

Anti-Inflammatory and Immunomodulatory Effects of 0.1 Sub-Terahertz Irradiation in Collagen-Induced Arthritis Mice

Qi Zhang et al. Int J Mol Sci. .

Abstract

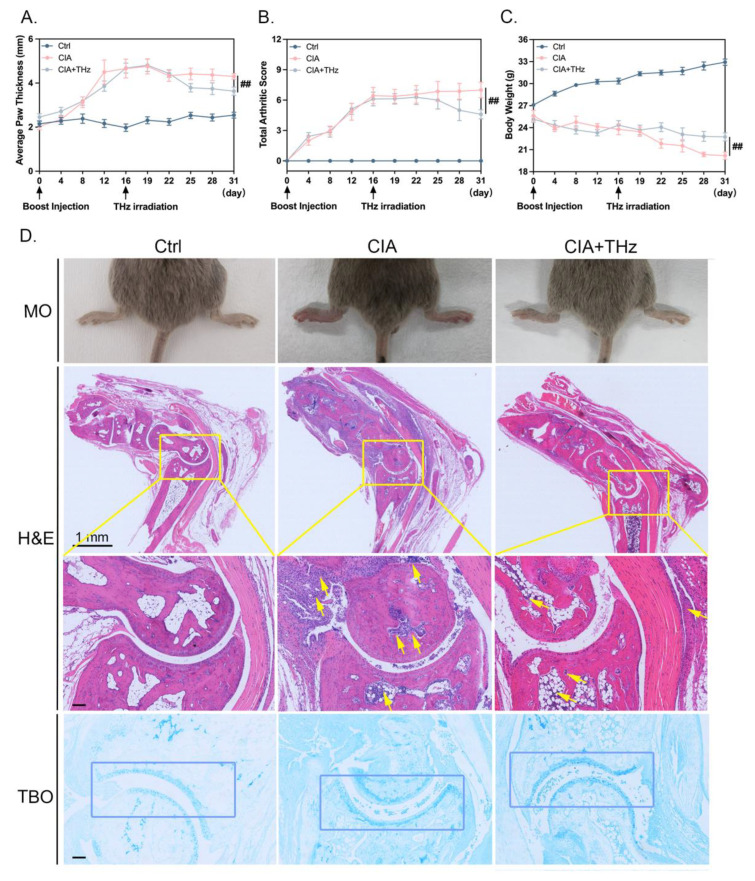
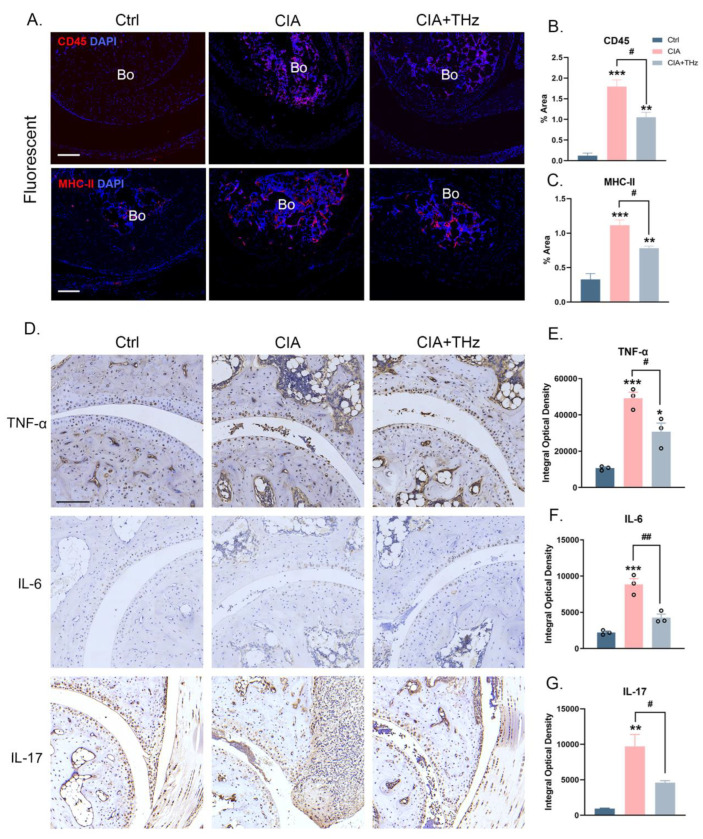
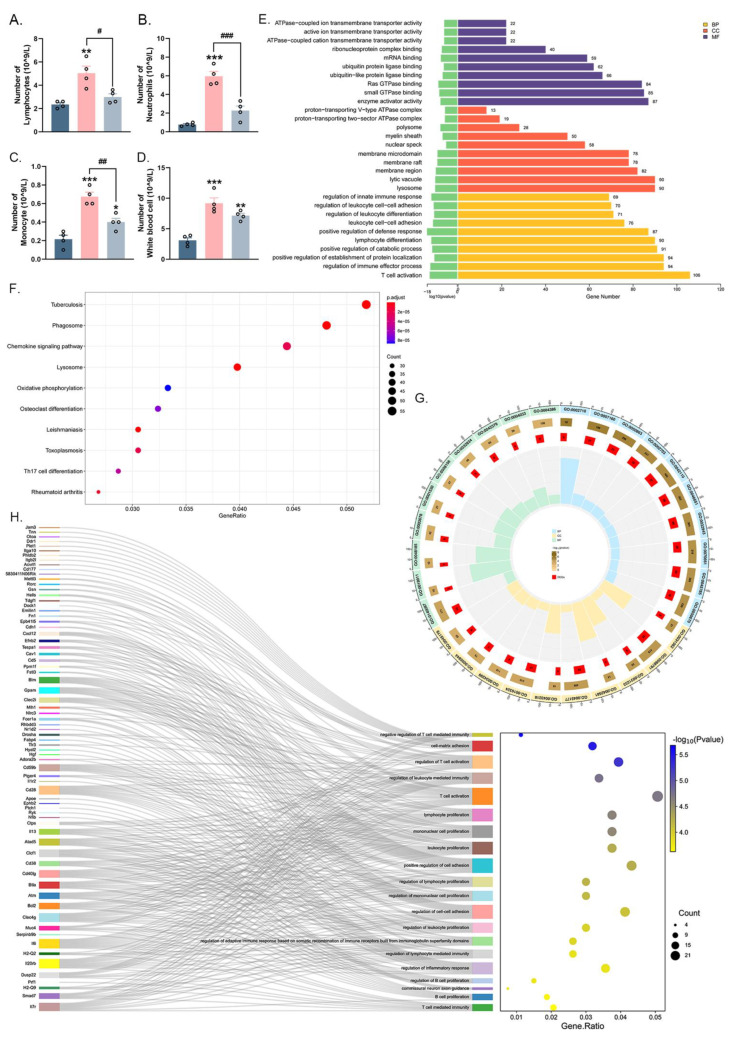
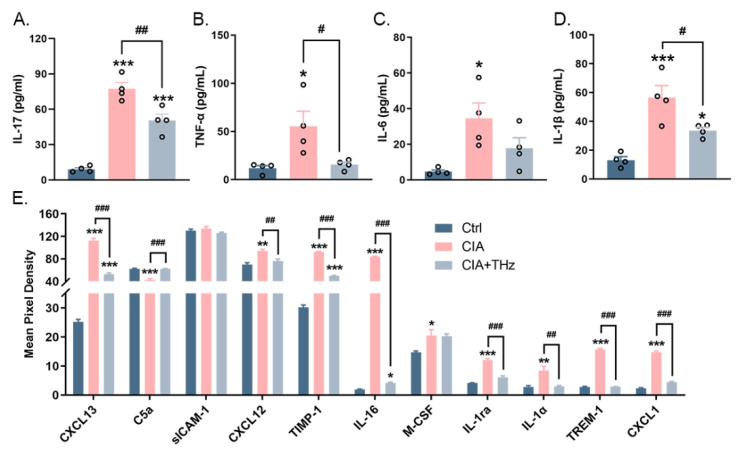
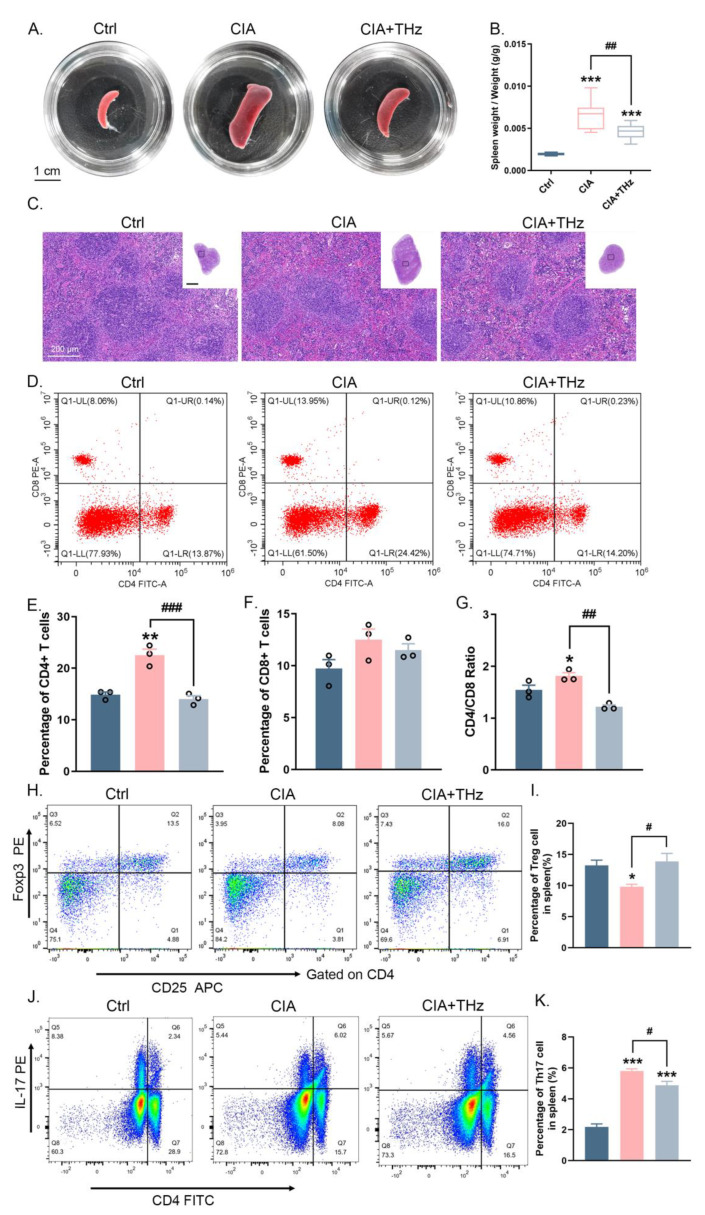
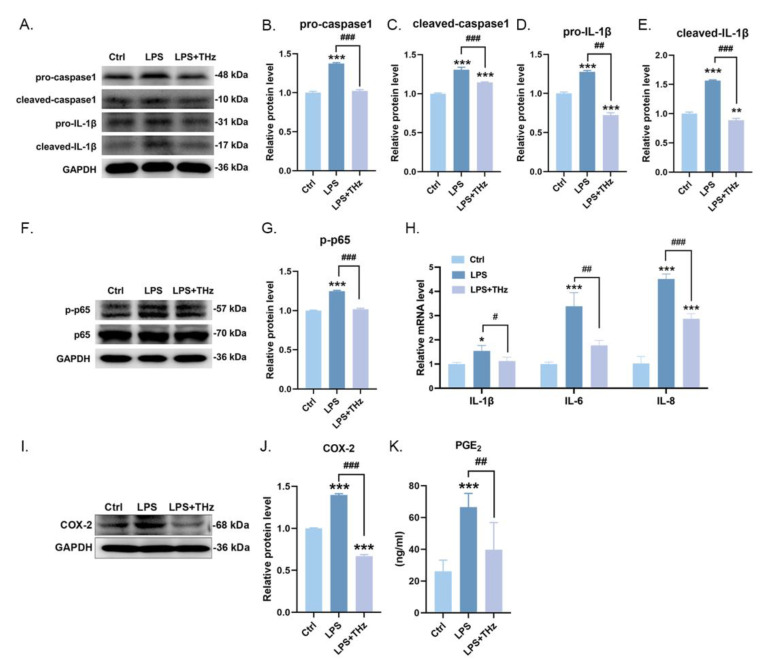
The primary emphasis of photoimmunology is the impact of nonionizing radiation on the immune system. With the development of terahertz (THz) and sub-terahertz (sub-THz) technology, the biological effects of this emerging nonionizing radiation, particularly its influence on immune function, remain insufficiently explored but are progressively attracting attention. Here, we demonstrated that 0.1 sub-THz radiation can modulate the immune system and alleviate symptoms of arthritis in collagen-induced arthritis (CIA) mice through a nonthermal manner. The application of 0.1 sub-THz irradiation led to a decrease in proinflammatory factors within the joints and serum, reducing the levels of blood immune cells and the quantity of splenic CD4+ T cells. Notably, 0.1 sub-THz irradiation restored depleted Treg cells in CIA mice and re-established the Th17/Treg equilibrium. These findings suggested that sub-THz irradiation plays a crucial role in systemic immunoregulation. Further exploration of its immune modulation mechanisms revealed the anti-inflammatory properties of 0.1 sub-THz on LPS-stimulated skin keratinocytes. Through the reduction in NF-κB signaling and NLRP3 inflammasome activation, 0.1 sub-THz irradiation effectively decreased the production of inflammatory factors and immune-active substances, including IL-1β and PGE2, in HaCaT cells. Consequently, 0.1 sub-THz irradiation mitigated the inflammatory response and contributed to the maintenance of immune tolerance in CIA mice. This research provided significant new evidence supporting the systemic impacts of 0.1 sub-THz radiation, particularly on the immune system. It also enhanced the field of photoimmunology and offered valuable insights into the potential biomedical applications of 0.1 sub-THz radiation for treating autoimmune diseases.

Keywords: CIA mice; HaCaT; immunity; inflammation; terahertz irradiation.


Conflict of interest statement

The authors declare that they have no competing interests.

Figures

Figure 1
Figure 1
Irradiation of 0.1 sub-THz attenuated joint swelling in CIA mice. (A). Average paw thickness of mice (mm) from the day of boost injection. (B). Total arthritis score from the day of boost injection. (C). The body weight (g) from the day of boost injection. (D). Morphology (MO) of ankle joint, histopathological analysis (H&E), and Toluidine Blue O (TBO) staining of mice from Ctrl, CIA, and CIA + THz group, respectively. Data are presented as the mean ± SEM (n = 6 mice per group). Scale bar, 1 mm; scale bar in the enlarged diagram from the yellow box, 100 μm; the yellow arrows: neutrophil infiltration; the blue boxes: articular cartilage area. Symbol for the significance of differences compared to the CIA group: ## p < 0.01.
Figure 2
Figure 2
Irradiation of 0.1 sub-THz reduced infiltrated leukocytes and proinflammatory cytokine levels in the ankle joint. (A). IF staining of CD45 (red), MHC-II (red), and DAPI (blue) in ankle joint from Ctrl, CIA, and CIA+THz group, respectively. Scale bar, 100 μm. Bo: bone. (B). Percentages of positive area of inflorescence staining of CD45 (** p < 0.01, *** p < 0.001, and # p < 0.05). (C). Percentages of positive area of inflorescence staining of MHC-II (** p < 0.01, *** p < 0.001, and # p < 0.05). (D). IHC staining of TNF-α, IL-6, and IL-17 in ankle joint from each group, respectively. Scale bar, 100 μm. (E). Integral optical density of IHC staining of TNF-α (* p < 0.05, *** p < 0.01, and # p < 0.05). (F). Integral optical density of IHC staining of IL-6 (*** p < 0.001 and ## p < 0.01). (G). Integral optical density of IHC staining of IL-17 (** p < 0.01 and # p < 0.05). Data are presented as the mean ± SEM (n = 3 mice per group). Symbol for the significance of differences compared to the Ctrl group: * p < 0.05, ** p < 0.01, *** p < 0.001; symbol for the significance of differences between the CIA group and CIA+THz group: # p < 0.05 and ## p < 0.01.
Figure 3
Figure 3
Analysis of blood cell components, murine hemocytes mRNA sequencing, and bioinformatics analysis. (A). Number of lymphocytes (** p < 0.01 and # p < 0.05). (B). Number of neutrophils (*** p < 0.001 and ### p < 0.001). (C). Number of monocytes (* p < 0.05, *** p < 0.001, and ## p < 0.01). (D). Number of white blood cells (** p < 0.05 and *** p < 0.001). (E). Top 10 GO analysis of DEGs from ANOVA analysis among Ctrl, CIA, and CIA+THz. (F). Top 10 KEGG pathway analysis of DEGs from ANOVA analysis among Ctrl, CIA, and CIA+THz. (G). Top 10 GO analysis of DEGs cut off from |log2Fold Change| > 0.67 and p-value < 0.05 between CIA and CIA+THz group. (H). Top 20 BP category in GO analysis of DEGs cut off from |log2Fold Change|>0.67 and p-value <0.05 between CIA and CIA+THz group. The GO analysis of DEGs including three main GO categories: Molecular Function (MF), Cellular Component (CC), and Biological Process (BP).
Figure 4
Figure 4
Detection of key cytokines’ content in serum. (A). Content of IL-17 in serum (*** p < 0.001 and ## p < 0.01). (B). Content of TNF-α in serum (* p < 0.05 and # p < 0.05). (C). Content of IL-6 in serum (* p < 0.05). (D). Content of IL-1β in serum (* p < 0.05, *** p < 0.001 and # p < 0.05). (E). Mean pixel density of significant enriched cytokines. Data are presented as the mean ± SEM (n = 4 mice per group) (* p < 0.05, ** p < 0.01, and *** p < 0.001; # p < 0.05, ## p < 0.01, and ### p < 0.001). Symbol for the significance of differences compared to the Ctrl group: * p < 0.05, ** p < 0.01, and *** p < 0.001; symbol for the significance of differences between the CIA group and CIA+THz group: # p < 0.05, ## p < 0.01, and ### p < 0.001.
Figure 5
Figure 5
Radiation of 0.1 sub-THz reduced the immune activation in the spleen of CIA mice. (A). Morphology of mice spleen from Ctrl, CIA, and CIA+THz group, respectively. (B). Ratio of spleen weight and body weight of mice (*** p < 0.001 and ## p < 0.01). (C). Overall vision (upper right corner) and local magnification of H&E staining of mice spleen from Ctrl, CIA, and CIA+THz group, respectively. Scale bar in overall vision, 2 mm; scale bar in local magnification, 200 μm; arrows denote macrophages. WhPu: white pulp; RePu: red pulp. (D). Dot plots of flow cytometry analysis indicating CD4+ and CD8+ T cell in splenic lymphocyte in each group. (E). Percentage of CD4+ T cell in splenic lymphocyte in each group (** p < 0.01 and ### p < 0.001). (F). Percentage of CD8+ T cell in splenic lymphocyte in each group. (G). CD4 and CD8 ratio in each group (* p < 0.05 and ## p < 0.01). (H). Dot plots of flow cytometry analysis indicating Treg cell in splenic lymphocyte in each group. (I). Percentage of Treg cell in splenic lymphocytes in each group (* p < 0.05 and # p < 0.05). (J). Dot plots of flow cytometry analysis indicating Treg cell in splenic lymphocyte in each group. (K). Percentage of Treg cell in splenic lymphocytes in each group. Data are presented as the mean ± SEM (n = 3 mice per group) (# p < 0.05 and *** p < 0.001. Symbol for the significance of differences compared to the Ctrl group: * p < 0.05, ** p < 0.01, and *** p < 0.001; symbol for the significance of differences between the CIA group and CIA+THz group: # p < 0.05, ## p < 0.01, and ### p < 0.001.
Figure 6
Figure 6
Irradiation of 0.1 sub-THz elevated the LPS-stimulated keratocytes inflammatory responses. (A). Western blotting of caspase 1, IL-1β, and GAPDH. (B). Relative protein level of pro-caspase 1 (*** p < 0.001 and ### p < 0.001). (C). Relative protein level of cleaved-caspase 1 (*** p < 0.001 and ### p < 0.001). (D). Relative protein level of pro-IL-1β (*** p < 0.001 and ## p < 0.01). (E). Relative protein level of cleaved-IL-1β (** p < 0.01, *** p < 0.001, and ### p < 0.001). (F). Western blotting of p65, p-p65, and GAPDH. (G). Relative protein level of p-p65 (*** p < 0.001 and ### p < 0.001). (H). Relative mRNA level of IL-1β, IL-6, and IL-8 (* p < 0.05, *** p < 0.001, # p < 0.05, ## p < 0.01, and ### p < 0.001). (I). Western blotting of COX-2 and GAPDH. (J). Relative protein level of COX-2 (*** p < 0.001 and ### p < 0.001). (K). PGE2 content in serum (* p < 0.05, and *** p < 0.001and # p < 0.05 and ## p < 0.01). Data are presented as the mean ± SEM (n = 3 samples per group). Symbol for the significance of differences compared to the Ctrl group: * p < 0.05, ** p < 0.01, and *** p < 0.001; symbol for the significance of differences between the CIA group and CIA+THz group: # p < 0.05, ## p < 0.01, and ### p < 0.001.

Similar articles

Cited by

References

    1. Grundt J.E., Cerna C., Roth C.C., Ibey B.L., Lipscomb D., Echchgadda I., Wilmink G.J. Terahertz radiation triggers a signature gene expression profile in human cells; Proceedings of the 2011 International Conference on Infrared, Millimeter, and Terahertz Waves; Houston, TX, USA. 2–7 October 2011; p. 12442108.
    1. Echchgadda I., Cerna C.Z., Sloan M.A., Elam D.P., Ibey B.L. Optical Interactions with Tissue and Cells XXVI. SPIE; San Francisco, CA, USA: 2015. Effects of different terahertz frequencies on gene expression in human keratinocytes.
    1. Titova L.V., Ayesheshim A.K., Golubov A., Rodriguez-Juarez R., Woycicki R., Hegmann F.A., Kovalchuk O. Intense THz pulses down-regulate genes associated with skin cancer and psoriasis: A new therapeutic avenue? Sci. Rep. 2013;3:2363. doi: 10.1038/srep02363. - DOI - PMC - PubMed
    1. Hwang Y., Ahn J., Mun J., Bae S., Jeong Y.U., Vinokurov N.A., Kim P. In vivo analysis of THz wave irradiation induced acute inflammatory response in skin by laser-scanning confocal microscopy. Opt. Express. 2014;22:11465–11475. doi: 10.1364/OE.22.011465. - DOI - PubMed
    1. Kim K.-T., Park J., Jo S.J., Jung S., Kwon O.S., Gallerano G.P., Park W.-Y., Park G.-S. High-power femtosecond-terahertz pulse induces a wound response in mouse skin. Sci. Rep. 2013;3:2296. doi: 10.1038/srep02296. - DOI - PMC - PubMed

MeSH terms