

Molecular Evolution of SNAREs in Vitis vinifera and Expression Analysis under Phytohormones and Abiotic Stress
- PMID: 38892171
- PMCID: PMC11173047
- DOI: 10.3390/ijms25115984
Molecular Evolution of SNAREs in Vitis vinifera and Expression Analysis under Phytohormones and Abiotic Stress
Abstract
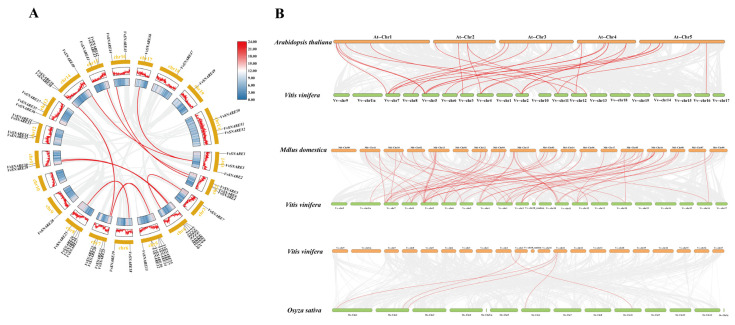
SNARE proteins (soluble N-ethylmaleimide-sensitive factor attachment protein receptors) play a key role in mediating a variety of plant biological processes. Currently, the function of the SNARE gene family in phytohormonal and abiotic stress treatments in grapevine is currently unknown, making it worthwhile to characterize and analyze the function and expression of this family in grapevine. In the present study, 52 VvSNARE genes were identified and predominantly distributed on 18 chromosomes. Secondary structures showed that the VvSNARE genes family irregular random coils and α-helices. The promoter regions of the VvSNARE genes were enriched for light-, abiotic-stress-, and hormone-responsive elements. Intraspecific collinearity analysis identified 10 pairs collinear genes within the VvSNARE family and unveiled a greater number of collinear genes between grapevine and apple, as well as Arabidopsis thaliana, but less associations with Oryza sativa. Quantitative real-time PCR (qRT-PCR) analyses showed that the VvSNARE genes have response to treatments with ABA, NaCl, PEG, and 4 °C. Notably, VvSNARE2, VvSNARE14, VvSNARE15, and VvSNARE17 showed up-regulation in response to ABA treatment. VvSNARE2, VvSNARE15, VvSNARE18, VvSNARE19, VvSNARE20, VvSNARE24, VvSNARE25, and VvSNARE29 exhibited significant up-regulation when exposed to NaCl treatment. The PEG treatment led to significant down-regulation of VvSNARE1, VvSNARE8, VvSNARE23, VvSNARE25, VvSNARE26, VvSNARE31, and VvSNARE49 gene expression. The expression levels of VvSNARE37, VvSNARE44, and VvSNARE46 were significantly enhanced after exposure to 4 °C treatment. Furthermore, subcellular localization assays certified that VvSNARE37, VvSNARE44, and VvSNARE46 were specifically localized at the cell membrane. Overall, this study showed the critical role of the VvSNARE genes family in the abiotic stress response of grapevines, thereby providing novel candidate genes such as VvSNARE37, VvSNARE44, and VvSNARE46 for further exploration in grapevine stress tolerance research.
Keywords: SNARE gene family; abiotic stress; grapevine; qRT-PCR; subcellular localization.
Conflict of interest statement
The authors declare that they have no conflicts of interest associated with this work.
Figures


Similar articles
-
The Characteristics and Expression Analysis of the Tomato SlRBOH Gene Family under Exogenous Phytohormone Treatments and Abiotic Stresses.Int J Mol Sci. 2024 May 26;25(11):5780. doi: 10.3390/ijms25115780. Int J Mol Sci. 2024. PMID: 38891968 Free PMC article.
-
Genome-wide analysis of the Universal stress protein A gene family in Vitis and expression in response to abiotic stress.Plant Physiol Biochem. 2021 Aug;165:57-70. doi: 10.1016/j.plaphy.2021.04.033. Epub 2021 May 17. Plant Physiol Biochem. 2021. PMID: 34034161
-
Analysis of GATA transcription factors and their expression patterns under abiotic stress in grapevine (Vitis vinifera L.).BMC Plant Biol. 2023 Dec 2;23(1):611. doi: 10.1186/s12870-023-04604-1. BMC Plant Biol. 2023. PMID: 38041099 Free PMC article.
-
Genome-wide analysis and expression profile of the bZIP transcription factor gene family in grapevine (Vitis vinifera).BMC Genomics. 2014 Apr 13;15:281. doi: 10.1186/1471-2164-15-281. BMC Genomics. 2014. PMID: 24725365 Free PMC article.
-
Genome-wide identification of the class III POD gene family and their expression profiling in grapevine (Vitis vinifera L).BMC Genomics. 2020 Jun 29;21(1):444. doi: 10.1186/s12864-020-06828-z. BMC Genomics. 2020. PMID: 32600251 Free PMC article.
References
-
- Guo B.B., Li J.M., Xing L.I., Xin Q.I., Musana R.F., Peng W.A., Zhang S.L., Wu J.Y. Identification and expression analysis of the PbrMLO gene family in pear, and functional verification of PbrMLO23. J. Integr. Agric. 2021;20:2410–2423. doi: 10.1016/S2095-3119(20)63558-4. - DOI
MeSH terms
Substances
Grants and funding
LinkOut - more resources
Full Text Sources
