. 2024 May 30;25(11):6013.
doi: 10.3390/ijms25116013.

PvdL Orchestrates the Assembly of the Nonribosomal Peptide Synthetases Involved in Pyoverdine Biosynthesis in Pseudomonas aeruginosa

Affiliations

PvdL Orchestrates the Assembly of the Nonribosomal Peptide Synthetases Involved in Pyoverdine Biosynthesis in Pseudomonas aeruginosa

Hanna Manko et al. Int J Mol Sci. .

Abstract

The pyoverdine siderophore is produced by Pseudomonas aeruginosa to access iron. Its synthesis involves the complex coordination of four nonribosomal peptide synthetases (NRPSs), which are responsible for assembling the pyoverdine peptide backbone. The precise cellular organization of these NRPSs and their mechanisms of interaction remain unclear. Here, we used a combination of several single-molecule microscopy techniques to elucidate the spatial arrangement of NRPSs within pyoverdine-producing cells. Our findings reveal that PvdL differs from the three other NRPSs in terms of localization and mobility patterns. PvdL is predominantly located in the inner membrane, while the others also explore the cytoplasmic compartment. Leveraging the power of multicolor single-molecule localization, we further reveal co-localization between PvdL and the other NRPSs, suggesting a pivotal role for PvdL in orchestrating the intricate biosynthetic pathway. Our observations strongly indicates that PvdL serves as a central orchestrator in the assembly of NRPSs involved in pyoverdine biosynthesis, assuming a critical regulatory function.

Keywords: DNA-PAINT; FLIM-FRET; NRPSs; Pseudomonas aeruginosa; co-localization; pyoverdine; sptPALM; super-resolution microscopy.


Conflict of interest statement

The funders had no role in the study design, data collection and interpretation, or the decision to submit the work for publication. The authors declare no other competing financial interests.

Figures

Figure 1
Figure 1
Assembly of the pyoverdine molecule. The cytoplasmic pyoverdine precursor is assembled by four NRPSs (PvdL, PvdI, PvdJ, and PvdD) with three smaller enzymes (PvdH, PvdA, and PvdF) providing modified amino acids. Every NRPS adds blocks (like amino acids) in the peptide backbone. In the very first step, PvdL introduces myristic acid, which is removed once the pyoverdine precursor is transported into the periplasm and before it undergoes maturation of the chromophore.
Figure 2
Figure 2
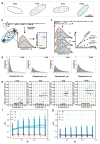
(a) Representative z-axis slice projections of 3D localizations of labeled PvdD in fixed bacterial cells on a glass coverslip (scale bar = 2 μm). Some cross-sections of bacteria are presented in the colored boxes (scale bar = 1 μm. (b) DNA-PAINT principle: DNA-PAINT uses DNA’s specific interactions for super-resolution imaging. Fluorescently tagged DNA strands (imagers) briefly bind to target molecules tagged with complementary DNA (docking strand) to create the necessary ‘blinking’ for precise localization and high-resolution image reconstruction in single-molecule localization microscopy. (c) z-projections and cross-sections obtained for PvdL, PvdI, and PvdJ in fixed P. aeruginosa cells (scale bars = 1 μm).
Figure 3
Figure 3
(a) Diffusion maps: Representative diffusion maps for PvdL, I, J, and D illustrate differences in the number of trajectories and explored surface areas. (b) Jump distances are computed from molecule trajectories using a fixed elapsed time. During a given time interval Δt, slowly diffusing molecules experience small jumps (orange), while faster diffusing molecules experience large jumps over the same time interval (blue). The jump distributions are estimated using a histogram from which the diffusion coefficients and the relative amplitude of the different diffusing subpopulations can be extracted. (c) Mean square displacement: By varying the time intervals, new jumps can be calculated, resulting in different distributions unless the molecules are immobile. The mean square displacement of the different subpopulations of diffusing molecules can be estimated to distinguish between free, confined, or immobile diffusion. (d) Experimental jump distance histograms corresponding to one field of view in the sample. The histograms were fitted using a two-component model, with fast (blue line) and slow (orange line) diffusion regimes. (e) Diffusion parameters: The diffusion coefficients and the corresponding amplitudes of the fast (blue dots) and the slow (orange dots) diffusion modes were determined. Each dot corresponds to the coefficient calculated by analyzing all the tracks containing more than three spots in one field of view. The median values of the diffusion coefficient are shown as black dashed lines. (f) Mean square displacement: MSD (median ± sd) as a function of Δt for the fast regimes of diffusion of the NRPSs. (g) Mean square displacement as a function of Δt for the slow regimes of diffusion of the NRPSs.
Figure 4
Figure 4
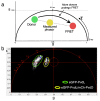
(a) Phasor approach principle. On a phasor plot, each phasor point is obtained by a transformation of the fluorescence decay of one FLIM pixel. The phasor coordinates are defined by real (g) and imaginary (s) parts of the Fourier transform. The position of the donor in the phasor plot will depend on its lifetime (green filled circle). When all the donor molecules undergo FRET with a high transfer efficiency, the phasor is shifted in the direction of lower lifetimes (red filled circle). In the case of a lower FRET efficiency, the phasor will stand on the line joining the two previously described positions (yellow filled circle). (b) Phasor plot. A clear shift between phasors of the donor (eGFP-PvdL, green oval) and the donor acceptor pair (eGFP-Pvdl/mCh-PvdD, yellow oval) can be seen, showing a protein–protein interaction between PvdL and PvdD.
Figure 5
Figure 5
(a) Two-color localization microscopy Scatter plot of the localizations of single eGFP-PvdL (green) and PvdJ-mCherry (purple) in a cell showing partial co-localization of the two enzymes. (b) Illustration of Mander’s overlap coefficients. Mander’s overlap coefficients show how much two fluorescent signals (M1 green and M2 purple, for example) in an image overlap. MOC indicates the area fraction of one signal localization that is also present in locations where the other channel is present. MOC ranges from 0 to 1. Asymmetric MOC values show how the spread and/or densities of co-localizations differ. (c) M1 and M2 Mander’s overlap coefficients calculated for eGFP-PvdL/PvdJ-mCherry and PvdJ-eGFP/mCherry-PvdL. (d) Mander’s overlap coefficients obtained for PvdL with the three other NRPSs. The highest values were obtained for the PvdL/PvdD and PvdL/PvdI pairs.

Similar articles

Cited by

References

    1. Crone S., Vives-Flórez M., Kvich L., Saunders A.M., Malone M., Nicolaisen M.H., Martínez-García E., Rojas-Acosta C., Catalina Gomez-Puerto M., Calum H., et al. The environmental occurrence of Pseudomonas aeruginosa. Apmis. 2020;128:220–231. doi: 10.1111/apm.13010. - DOI - PubMed
    1. Vining L.C. Secondary metabolism, inventive evolution and biochemical diversity—A review. Gene. 1992;115:135–140. doi: 10.1016/0378-1119(92)90551-Y. - DOI - PubMed
    1. Gross H., Loper J.E. Genomics of secondary metabolite production by Pseudomonas spp. Nat. Prod. Rep. 2009;26:1408–1446. doi: 10.1039/b817075b. - DOI - PubMed
    1. Dell M., Dunbar K.L., Hertweck C. Ribosome-independent peptide biosynthesis: The challenge of a unifying nomenclature. Nat. Prod. Rep. 2021;39:453–459. doi: 10.1039/d1np00019e. - DOI - PubMed
    1. Gulick A.M. Nonribosomal peptide synthetase biosynthetic clusters of ESKAPE pathogens. Nat. Prod. Rep. 2017;34:981–1009. doi: 10.1039/c7np00029d. - DOI - PMC - PubMed

MeSH terms

LinkOut - more resources