Integrative ATAC-seq and RNA-seq Analysis of the Longissimus Dorsi Muscle of Gannan Yak and Jeryak
- PMID: 38892214
- PMCID: PMC11172533
- DOI: 10.3390/ijms25116029
Integrative ATAC-seq and RNA-seq Analysis of the Longissimus Dorsi Muscle of Gannan Yak and Jeryak
Abstract
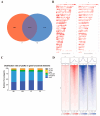
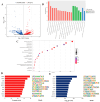
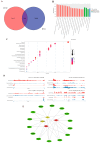
Jeryak is the F1 generation of the cross between Gannan yak and Jersey cattle, which has the advantages of fast growth and high adaptability. The growth and development of skeletal muscle is closely linked to meat production and the quality of meat. However, the molecular regulatory mechanisms of muscle growth differences between Gannan yak and Jeryak analyzed from the perspective of chromatin opening have not been reported. In this study, ATAC-seq was used to analyze the difference of chromatin openness in longissimus muscle of Gannan yak and Jeryak. It was found that chromatin accessibility was more enriched in Jeryak compared to Gannan yak, especially in the range of the transcription start site (TSS) ± 2 kb. GO and KEGG enrichment analysis indicate that differential peak-associated genes are involved in the negative regulation of muscle adaptation and the Hippo signaling pathway. Integration analysis of ATAC-seq and RNA-seq revealed overlapping genes were significantly enriched during skeletal muscle cell differentiation and muscle organ morphogenesis. At the same time, we screened FOXO1, ZBED6, CRY2 and CFL2 for possible involvement in skeletal muscle development, constructed a genes and transcription factors network map, and found that some transcription factors (TFs), including YY1, KLF4, KLF5 and Bach1, were involved in skeletal muscle development. Overall, we have gained a comprehensive understanding of the key factors that impact skeletal muscle development in various breeds of cattle, providing new insights for future analysis of the molecular regulatory mechanisms involved in muscle growth and development.
Keywords: ATAC-seq; Jeryaks; RNA-seq; heterosis; longissimus muscle.
Conflict of interest statement
The authors declare that the research was conducted in the absence of any commercial or financial relationships that could be construed as a potential conflict of interest.
Figures


Similar articles
-
Comprehensive Analysis of miRNA and mRNA Expression Profiles during Muscle Development of the Longissimus Dorsi Muscle in Gannan Yaks and Jeryaks.Genes (Basel). 2023 Dec 15;14(12):2220. doi: 10.3390/genes14122220. Genes (Basel). 2023. PMID: 38137042 Free PMC article.
-
Integration of ATAC-Seq and RNA-Seq Analysis to Identify Key Genes in the Longissimus Dorsi Muscle Development of the Tianzhu White Yak.Int J Mol Sci. 2023 Dec 21;25(1):158. doi: 10.3390/ijms25010158. Int J Mol Sci. 2023. PMID: 38203329 Free PMC article.
-
Transcriptome Analysis of mRNA and lncRNA Related to Muscle Growth and Development in Gannan Yak and Jeryak.Int J Mol Sci. 2023 Nov 30;24(23):16991. doi: 10.3390/ijms242316991. Int J Mol Sci. 2023. PMID: 38069312 Free PMC article.
-
Integrative Analysis of ATAC-Seq and RNA-Seq Identifies Key Genes Affecting Muscle Development in Ningxiang Pigs.Int J Mol Sci. 2025 Mar 14;26(6):2634. doi: 10.3390/ijms26062634. Int J Mol Sci. 2025. PMID: 40141276 Free PMC article.
-
Interrogating the Accessible Chromatin Landscape of Eukaryote Genomes Using ATAC-seq.Methods Mol Biol. 2021;2243:183-226. doi: 10.1007/978-1-0716-1103-6_10. Methods Mol Biol. 2021. PMID: 33606259 Review.
Cited by
-
Genome-wide chromatin accessibility and selective signals of meat rabbits reveal key Cis-regulatory elements and variants during postnatal development of skeletal muscles in rabbits.BMC Genomics. 2025 Mar 25;26(1):296. doi: 10.1186/s12864-025-11496-y. BMC Genomics. 2025. PMID: 40133827 Free PMC article.
-
Current status of transcriptome sequencing technology in ruminants.Front Vet Sci. 2025 Jun 26;12:1558799. doi: 10.3389/fvets.2025.1558799. eCollection 2025. Front Vet Sci. 2025. PMID: 40642274 Free PMC article. Review.
-
The Multifaceted Roles of BACH1 in Disease: Implications for Biological Functions and Therapeutic Applications.Adv Sci (Weinh). 2025 Mar;12(10):e2412850. doi: 10.1002/advs.202412850. Epub 2025 Jan 30. Adv Sci (Weinh). 2025. PMID: 39887888 Free PMC article. Review.
References
-
- Guo S.Z., Ma D.L., Li B.M., Baozhaxi J.C., Zhang T.Y., Xu G.Q., Zhang H.X., Wang L.B., Lamao J.B., Wang W.B., et al. Determination of growth and development indexes of Jeryak in Gannan alpine pasture area. Chin. Herbiv. Sci. 2019;39:73–75.
-
- Guo S.Z., Ma D.L., Yu S.J., Li B.M., Baozhaxi J.C., Wang L.B., Ma Z.T., Zhang Y.Z., Niu X.Y., Zhou J., et al. Observations on the effect of crossbreeding between Jersey cattle and Gannan yaks in alpine pastures. Chin. Bov. Sci. 2018;44:32–35.
MeSH terms
Substances
Grants and funding
LinkOut - more resources
Full Text Sources
Research Materials
Miscellaneous

