. 2024 May 31;25(11):6096.
doi: 10.3390/ijms25116096.

On the Cholesterol Raising Effect of Coffee Diterpenes Cafestol and 16- O-Methylcafestol: Interaction with Farnesoid X Receptor

Affiliations

On the Cholesterol Raising Effect of Coffee Diterpenes Cafestol and 16- O-Methylcafestol: Interaction with Farnesoid X Receptor

Elena Guercia et al. Int J Mol Sci. .

Abstract

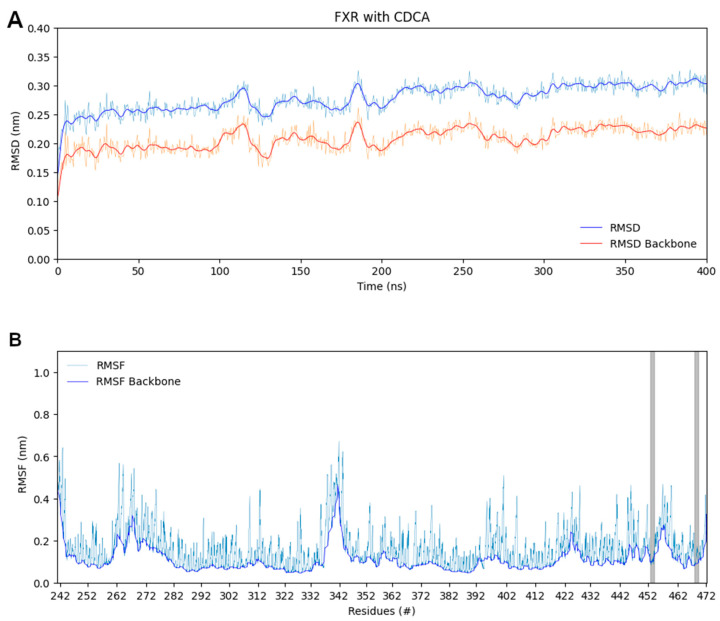
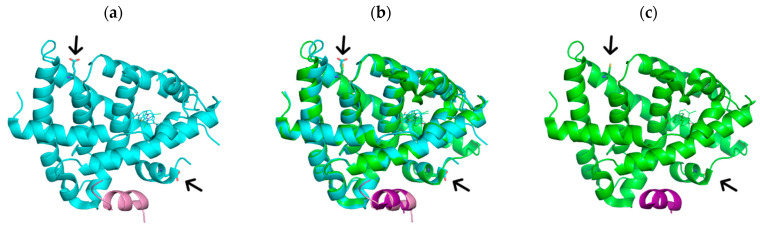
The diterpene cafestol represents the most potent cholesterol-elevating compound known in the human diet, being responsible for more than 80% of the effect of coffee on serum lipids, with a mechanism still not fully clarified. In the present study, the interaction of cafestol and 16-O-methylcafestol with the stabilized ligand-binding domain (LBD) of the Farnesoid X Receptor was evaluated by fluorescence and circular dichroism. Fluorescence quenching was observed with both cafestol and 16-O-methylcafestol due to an interaction occurring in the close environment of the tryptophan W454 residue of the protein, as confirmed by docking and molecular dynamics. A conformational change of the protein was also observed by circular dichroism, particularly for cafestol. These results provide evidence at the molecular level of the interactions of FXR with the coffee diterpenes, confirming that cafestol can act as an agonist of FXR, causing an enhancement of the cholesterol level in blood serum.

Keywords: 16-O-methylcafestol; FXR; cafestol; circular dichroism; coffee; fluorescence.


Conflict of interest statement

Authors Elena Guercia and Luciano Navarini were employed by the company illycaffè S.p.A. The remaining authors declare that the research was conducted in the absence of any commercial or financial relationships that could be construed as a potential conflict of interest.

Figures

Figure A1
Figure A1
Emission (λexc = 280 nm) spectra of 10 μM solutions of FXT-WT (A) and FXR-CCEE (B) in phosphate buffer, in the absence of ligands and in the presence of increasing concentrations of GW4046 ranging from 1 μM to 30 μM.
Figure A2
Figure A2
Emission (λexc = 280 nm) spectra of 10 μM solutions of FXT-WT (A) and FXR-CCEE (B) in phosphate buffer, in the absence of ligands and in the presence of increasing concentrations of GG ranging from 1 μM to 30 μM.
Figure A3
Figure A3
Lehrer plot for the fluorescence quenching of intrinsic emission of FXR-CCEE with CAF and 16OMC.
Figure A4
Figure A4
Thermogram (upper panel) and Titration Isotherm (lower panel) of GW4064 into FXR-CCEE solution.
Figure A5
Figure A5
Four hundred nanosecond MD simulation of the CDCA ligand bound to the LBD of FXR. (A) RMSD of the CDCA molecule along the trajectory. (B) RMSD of the Trp residues along the trajectory, Trp 454 in blue and Trp 469 in grey. Thick lines represent the curves smoothed using a Gaussian filter at 3.0 σ.
Figure A6
Figure A6
Four hundred nanosecond MD simulation of the CAF ligand bound to the LBD of FXR. (A) RMSD of the protein along the trajectory showing that a single conformational state is occupied by the protein. Thick lines represent the curves smoothed using a Gaussian filter at 3.0 σ. (B) RMSF of protein residues confirms a higher mobility of Trp 454 compared to Trp 469 (in grey). A significant movement of the loop between helices H5 and H6 can be observed between residues 340 and 344 in this plot, confirming previous results from Kumari et al. [57]. Thick lines represent the protein backbone RMSF.
Figure A7
Figure A7
Four hundred nanosecond MD simulation of the CDCA ligand bound to the LBD of FXR. (A) RMSD of the protein along the trajectory showing that a single conformational state is occupied by the protein. Thick lines represent the curves smoothed using a Gaussian filter at 3.0 σ. (B) RMSF of protein residues confirms that Trp 454 and Trp 469 (in grey) have similar mobility. A significant movement of the loop between helices H5 and H6 can be observed between residues 340 and 344 in this plot, confirming previous results from Kumari et al. [57]. Thick lines represent the protein backbone RMSF.
Figure A8
Figure A8
Thermal shift assay of FXR wt and FXR-CCEE with diterpenes.
Figure 1
Figure 1
Structures of coffee diterpenes and of endogenous agonists CA, CDCA, LCA, and DCA, non-steroidal synthetic agonist GW4064, and antagonist GG of FXR.
Figure 2
Figure 2
Comparison between the crystal structures of the mutated C432E/C466E LBD of FXR (a), from the structure with PDB code 6A5Z (in cyan), and the wild-type LBD (c) from the structure with PDB code 6A5Z (in green). Panel (b) shows the superimposition between the two structures. Arrows highlight the positions of the mutated residues. The helical structures in magenta and pink represent the binding peptide used in crystallization experiments.
Figure 3
Figure 3
Emission (λexc = 280 nm) and synchronous spectra (Δ = 60 nm) of 1 μM solutions of the FXR-CCEE in phosphate buffer, in the absence of ligands (red spectra), and in the presence of increasing concentrations of CAF and 16OMC ranging from 100 nM (blue), 300 nM (purple), 500 nM (brown), 1 μM (pink), 3 μM (turquoise), 5 μM (ocher), 10 μM (light blue), 20 μM (magenta), 40 μM (green); evidence a decrease of the fluorescence signal upon binding of the diterpenes that is mainly related to the quenching of the tryptophan signal; (A): emission, CAF; (B): synchronous, CAF; (C): emission, 16OMC; (D): synchronous, 16OMC.
Figure 4
Figure 4
Stern–Volmer plots for the fluorescence emission quenching of 1 μM FXR-CCEE upon titration with CAF and 16OMC highlight a bimodal behavior at low and high concentrations of the ligand.
Figure 5
Figure 5
Docking analyses of CAF and 16OMC inside the binding site of FXR support the hypothesis that the ligand sits in close proximity to Trp 454 but not to Trp 469. MD simulation results confirm the mobility of the former residue. (A): best docking pose for CAF after optimization (Oxygen atoms are colored in red, nitrogen in blue, and hydrogen in white). (B): overlay of the best docking poses for CAF (green), 16OMC (yellow), and of CDCA (blue) inside FXR. (CE): interaction maps for CDCA (C), CAF (D), and 16OMC (E). (F): 400 ns MD simulation of the CAF ligand bound to the LBD of FXR, RMSD of the CAF molecule along the trajectory. (G): RMSD of the Trp residues along the trajectory. Thick lines represent the curves smoothed using a Gaussian filter at 3.0 σ.
Figure 5
Figure 5
Docking analyses of CAF and 16OMC inside the binding site of FXR support the hypothesis that the ligand sits in close proximity to Trp 454 but not to Trp 469. MD simulation results confirm the mobility of the former residue. (A): best docking pose for CAF after optimization (Oxygen atoms are colored in red, nitrogen in blue, and hydrogen in white). (B): overlay of the best docking poses for CAF (green), 16OMC (yellow), and of CDCA (blue) inside FXR. (CE): interaction maps for CDCA (C), CAF (D), and 16OMC (E). (F): 400 ns MD simulation of the CAF ligand bound to the LBD of FXR, RMSD of the CAF molecule along the trajectory. (G): RMSD of the Trp residues along the trajectory. Thick lines represent the curves smoothed using a Gaussian filter at 3.0 σ.
Figure 6
Figure 6
(A): CD spectra of WT-FXR (5 μM) and FXR-CCEE (5 μM) in PBS show a similar secondary structure content for the two forms; (B): CD spectra of FXR-CCEE in the time range 0–2 h and with 15% of methanol show that the protein retains the conformation and does not undergo denaturation in the presence of the alcohol; (C): CD spectra of CDCA, CAF and 16OMC in methanol are used as reference in the binding analysis.
Figure 7
Figure 7
CD spectra of FXR-CCEE with the ligand CAF (A) show an increase in secondary structure content upon increasing the concentration of the terpene. Binding of 16OMC (B) or CDCA (C) determine only a minor change in the CD spectra of the protein.
Figure 8
Figure 8
Thermal denaturation of FXR-CCEE with 15% methanol, as measured by CD at 210.2 and 225 nm and in the presence of CDCA (A,D), CAF (B,E), and 16OMC (C,F) is used to assess the stabilizing effect of the ligands on the protein folding.

Similar articles

Cited by

References

    1. Statista Coffee Consumption Worldwide from 2012/13 to 2021/22 with a Forecast to 2022/23. 2023. [(accessed on 31 October 2023)]. Available online: https://www.statista.com/statistics/292595/global-coffee-consumption/
    1. McLellana T.M., Caldwell J.A., Lieberman H.R. A review of caffeine’s effects on cognitive, physical and occupational performance. Neurosci. Biobehav. Rev. 2016;71:294–312. doi: 10.1016/j.neubiorev.2016.09.001. - DOI - PubMed
    1. Surma S., Sahebkar A., Banach M. Coffee or tea: Anti-inflammatory properties in the context of atherosclerotic cardiovascular disease prevention. Pharm. Res. 2023;187:106596. doi: 10.1016/j.phrs.2022.106596. - DOI - PubMed
    1. Makiso M.U., Tola Y.B., Ogah O., Endale F.L. Bioactive compounds in coffee and their role in lowering the risk of major public health consequences: A review. Food Sci. Nutr. 2024;12:734–764. doi: 10.1002/fsn3.3848. - DOI - PMC - PubMed
    1. Machado F., Coimbra M.A., del Castillo M.D., Coreta-Gomes F. Mechanisms of action of coffee bioactive compounds—A key to unveil the coffee paradox. Crit. Rev. Food Sci. Nutr. 2023:1–23. doi: 10.1080/10408398.2023.2221734. - DOI - PubMed

MeSH terms