. 2024 Jun 1;25(11):6123.
doi: 10.3390/ijms25116123.

Ibulocydine Inhibits Migration and Invasion of TNBC Cells via MMP-9 Regulation

Affiliations

Ibulocydine Inhibits Migration and Invasion of TNBC Cells via MMP-9 Regulation

Mi-Ri Kwon et al. Int J Mol Sci. .

Abstract

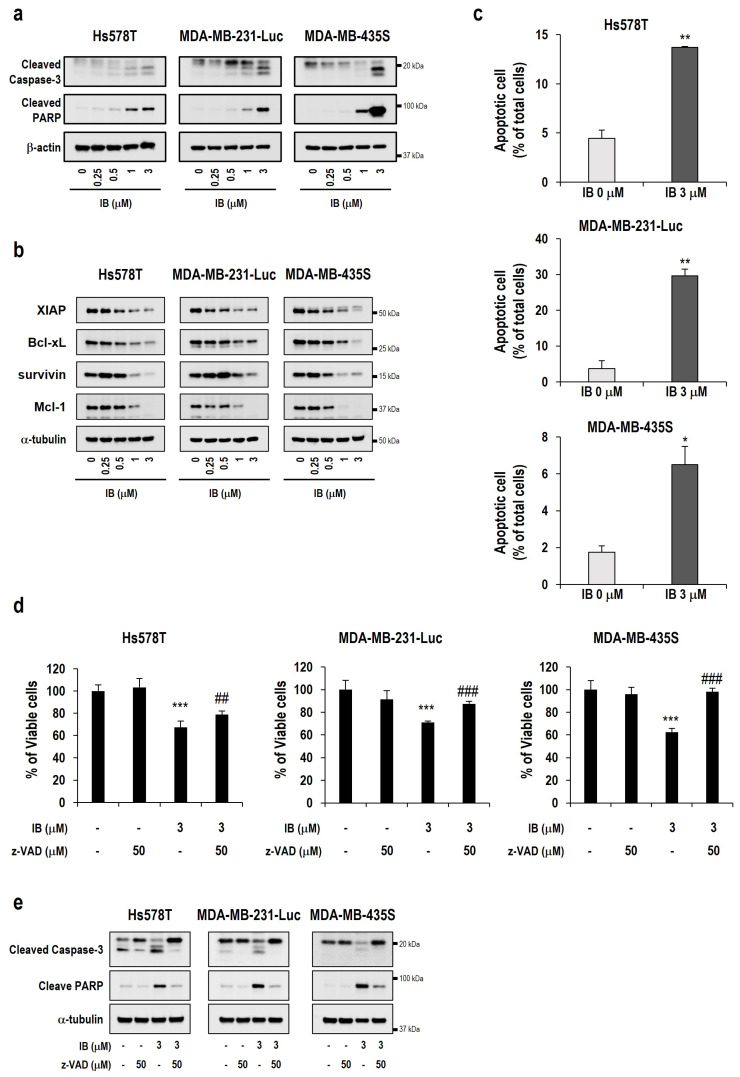
Triple-negative breast cancer (TNBC) accounts for approximately 15-20% of all breast cancer types, indicating a poor survival prognosis with a more aggressive biology of metastasis to the lung and a short response duration to available therapies. Ibulocydine (IB) is a novel (cyclin-dependent kinase) CDK7/9 inhibitor prodrug displaying potent anti-cancer effects against various cancer cell types. We performed in vitro and in vivo experiments to determine whether IB inhibits metastasis and eventually overcomes the poor drug response in TNBC. The result showed that IB inhibited the growth of TNBC cells by inducing caspase-mediated apoptosis and blocking metastasis by reducing MMP-9 expression in vitro. Concurrently, in vivo experiments using the metastasis model showed that IB inhibited metastasis of MDA-MB-231-Luc cells to the lung. Collectively, these results demonstrate that IB inhibited the growth of TNBC cells and blocked metastasis by regulating MMP-9 expression, suggesting a novel therapeutic agent for metastatic TNBC.

Keywords: ibulocydine; metastasis; triple-negative breast cancer.


Conflict of interest statement

All authors declare no competing financial or non-financial interests.

Figures

Figure 1
Figure 1
Ibulocydine induces cell death in various TNBC cells. (a) Patients with TNBC were divided by relatively high or low CDK7/CDK9 expression, and a Kaplan–Meier plot was generated. The differences between these groups were statistically significant regarding overall survival (OS), metastasis, and distant metastasis-free survival (DMFS). (b) Cell viability was measured using the CCK-8 assay after treatment with the indicated concentrations of IB for 24 h. The percentage of live cells was normalized to that of untreated control cells (100%). Data represent the mean ± SD. (c) Cells were treated with two different doses of IB and incubated for 10 days for colony-forming assays. Representative graphs with the number of colonies are shown. Data are presented as the mean ± SD. * p < 0.05, ** p < 0.01 vs. untreated control.
Figure 2
Figure 2
Ibulocydine induces apoptotic cell death. (a) TNBC cells were treated with the indicated IB concentrations for 24 h. Cell extracts were prepared from the treated cells, and Western blotting was performed using anti-cleaved caspase-3 and anti-cleaved PARP antibody. α-tubulin was used as a loading control. (b) Cell extracts were prepared from the cells treated with the indicated IB concentrations for 24 h. Western blotting of the anti-apoptotic family proteins was performed. α-tubulin was used as a loading control. (c) TNBC cells were treated with 3 μM IB for 24 h. After 24 h, apoptosis was measured with annexin V–FITC and PI staining using flow cytometry and was quantified. Data represent the mean ± SD. * p < 0.05, ** p < 0.01 vs. untreated control. (d) Various TNBC cells were pretreated with 50 µM z-VAD-fmk for 30 min and further treated with 3 μM IB for 24 h. Cell viability was assessed using the CCK-8 assay. Data represent the mean ± SD. *** p < 0.001 vs. untreated control. ## p < 0.01, ### p < 0.001 vs. IB treatment. (e) Cells were untreated or pretreated with 50 µM z-VAD-fmk and further treated with 3 μM IB for 24 h. Western blotting of the indicated proteins was performed. α-tubulin was used as a loading control.
Figure 3
Figure 3
MMP-9 downregulation is critical in IB-induced metastasis inhibition in human TNBC cells. (a) After treatment with 1 or 3 µM IB, wound healing scratch assays were performed using TNBC cells. Cell migration was monitored under a phase-contrast microscope for 24 h: Bar, 50 μm. Data are shown as the mean ± SD. * p < 0.05, *** p < 0.001 vs. 24 h untreated control. (b) Invasion assays of TNBC cells treated with 0.5 or 1 µM IB for 24 h were performed. Invading cells were stained with crystal violet and observed using a fluorescence microscope (4×). Data are presented as the mean ± SD. *** p < 0.001 vs. untreated control. (c) Cell extracts were prepared from cells treated with the indicated IB concentrations for 24 h. MMP-9 and MMP-2 levels were detected using Western blotting. α-tubulin was used as a loading control. (d) TNBC cells were treated with the indicated IB concentrations for 24 h. Cell extracts were prepared for Western blotting of mesenchymal markers. (e) MMP-9 overexpressing stable cells were scratched during wound healing assays. MMP-9 upregulation was confirmed using Western blotting. Cell migration was monitored for 24 h and observed under a phase-contrast microscope: Bar, 50 μm. The graphs quantitatively show the area of wound recovery. Data are presented as the mean ± SD. *** p < 0.0001 vs. IB-treated vector cells. (f) Invasion assays of MMP-9 overexpressing stable cell lines treated with 0.5 or 1 µM IB for 24 h were performed. Invading cells were stained with crystal violet and observed using a fluorescence microscope (4×). Data are shown as the mean ± SD. * p < 0.05, *** p < 0.001 vs. IB-treated vector cells.
Figure 3
Figure 3
MMP-9 downregulation is critical in IB-induced metastasis inhibition in human TNBC cells. (a) After treatment with 1 or 3 µM IB, wound healing scratch assays were performed using TNBC cells. Cell migration was monitored under a phase-contrast microscope for 24 h: Bar, 50 μm. Data are shown as the mean ± SD. * p < 0.05, *** p < 0.001 vs. 24 h untreated control. (b) Invasion assays of TNBC cells treated with 0.5 or 1 µM IB for 24 h were performed. Invading cells were stained with crystal violet and observed using a fluorescence microscope (4×). Data are presented as the mean ± SD. *** p < 0.001 vs. untreated control. (c) Cell extracts were prepared from cells treated with the indicated IB concentrations for 24 h. MMP-9 and MMP-2 levels were detected using Western blotting. α-tubulin was used as a loading control. (d) TNBC cells were treated with the indicated IB concentrations for 24 h. Cell extracts were prepared for Western blotting of mesenchymal markers. (e) MMP-9 overexpressing stable cells were scratched during wound healing assays. MMP-9 upregulation was confirmed using Western blotting. Cell migration was monitored for 24 h and observed under a phase-contrast microscope: Bar, 50 μm. The graphs quantitatively show the area of wound recovery. Data are presented as the mean ± SD. *** p < 0.0001 vs. IB-treated vector cells. (f) Invasion assays of MMP-9 overexpressing stable cell lines treated with 0.5 or 1 µM IB for 24 h were performed. Invading cells were stained with crystal violet and observed using a fluorescence microscope (4×). Data are shown as the mean ± SD. * p < 0.05, *** p < 0.001 vs. IB-treated vector cells.
Figure 4
Figure 4
Inhibition of metastasis by IB in metastasis animal models. (a) Schematic diagram of the establishment of the experimental metastasis animal model and experimental schedules. (b) BALB/c nude mice were intravenously injected with MDA-MB-231-Luc cells treated with 3 μM IB for 6 h. For 56 days, lung metastasis was monitored by IVIS spectrum. Quantitative graphs of luciferase total flux on days 14, 28, 42, and 56 are shown. Data are presented as the mean ± SD. *** p < 0.001 vs. control. (c) Mice with lung metastasis were sacrificed at the 56-day endpoint. Lung metastasis images were obtained using the IVIS spectrum. Quantitative graphs show the luciferase total flux. Data are shown as the mean ± SD. ** p < 0.01 vs. control.

Similar articles

Cited by

References

    1. Chavez K.J., Garimella S.V., Lipkowitz S. Triple negative breast cancer cell lines: One tool in the search for better treatment of triple negative breast cancer. Breast Dis. 2010;32:35–48. doi: 10.3233/bd-2010-0307. - DOI - PMC - PubMed
    1. Anders C.K., Carey L.A. Biology, metastatic patterns, and treatment of patients with triple-negative breast cancer. Clin. Breast Cancer. 2009;9 Suppl 2:S73–S81. doi: 10.3816/CBC.2009.s.008. - DOI - PMC - PubMed
    1. Kumar P., Aggarwal R. An overview of triple-negative breast cancer. Arch. Gynecol. Obstet. 2016;293:247–269. doi: 10.1007/s00404-015-3859-y. - DOI - PubMed
    1. Medina M.A., Oza G., Sharma A., Arriaga L.G., Hernández Hernández J.M., Rotello V.M., Ramirez J.T. Triple-Negative Breast Cancer: A Review of Conventional and Advanced Therapeutic Strategies. Int. J. Environ. Res. Public Health. 2020;17:2078. doi: 10.3390/ijerph17062078. - DOI - PMC - PubMed
    1. Knowlson C., Haddock P., Bingham V., McQuaid S., Mullan P.B., Buckley N.E. Pin1 plays a key role in the response to treatment and clinical outcome in triple negative breast cancer. Ther. Adv. Med. Oncol. 2020;12:1758835920906047. doi: 10.1177/1758835920906047. - DOI - PMC - PubMed

MeSH terms

LinkOut - more resources