. 2024 Jun 1;25(11):6133.
doi: 10.3390/ijms25116133.

The Role of TLR7 and TLR9 in the Pathogenesis of Systemic Sclerosis

Affiliations

The Role of TLR7 and TLR9 in the Pathogenesis of Systemic Sclerosis

Chenyang Wang et al. Int J Mol Sci. .

Abstract

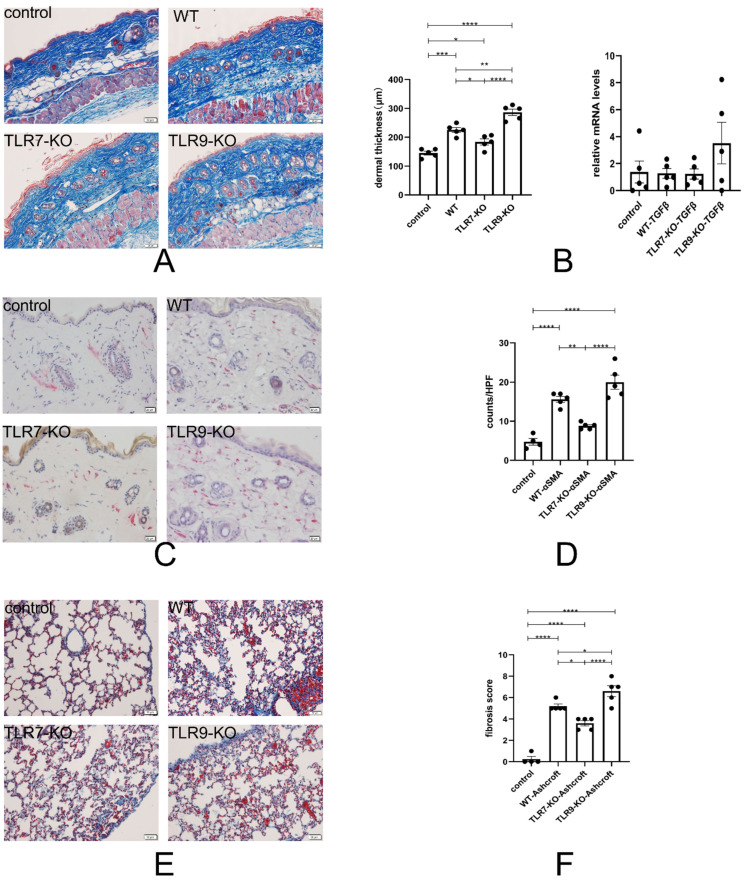
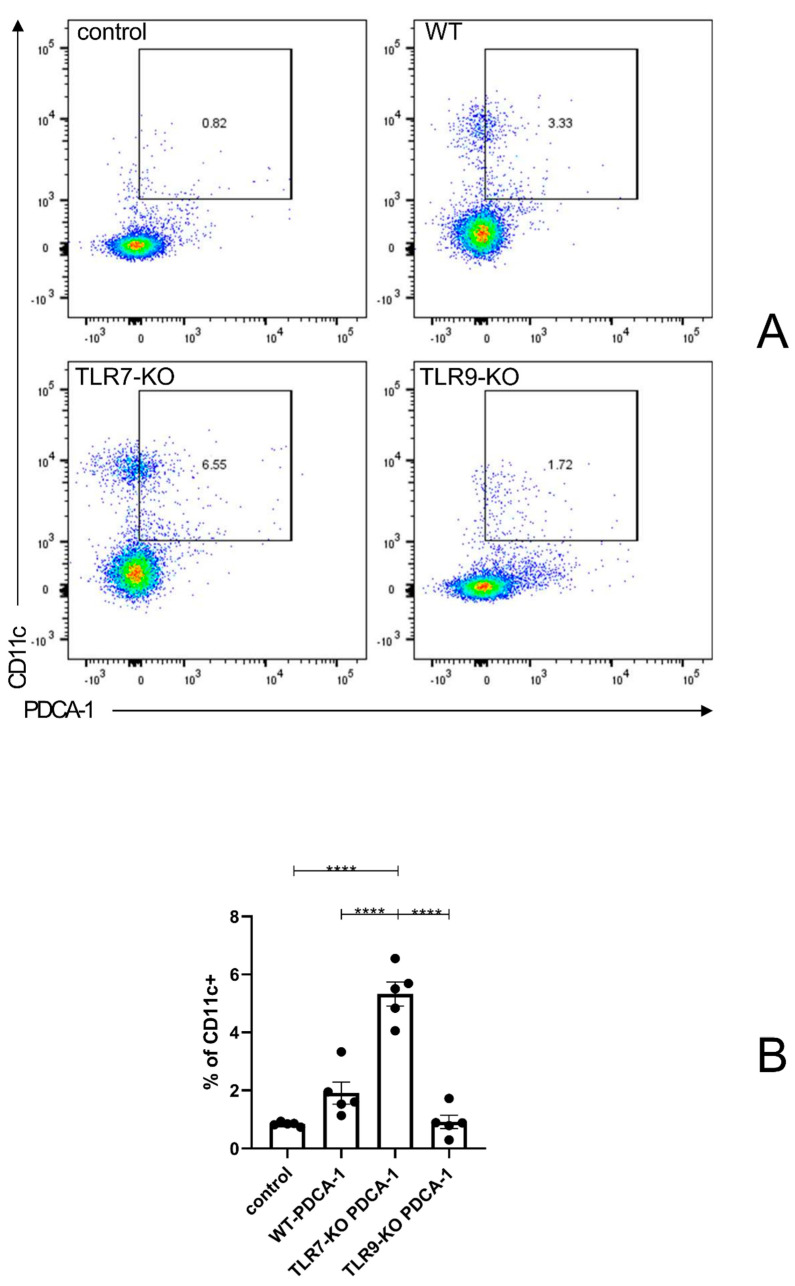
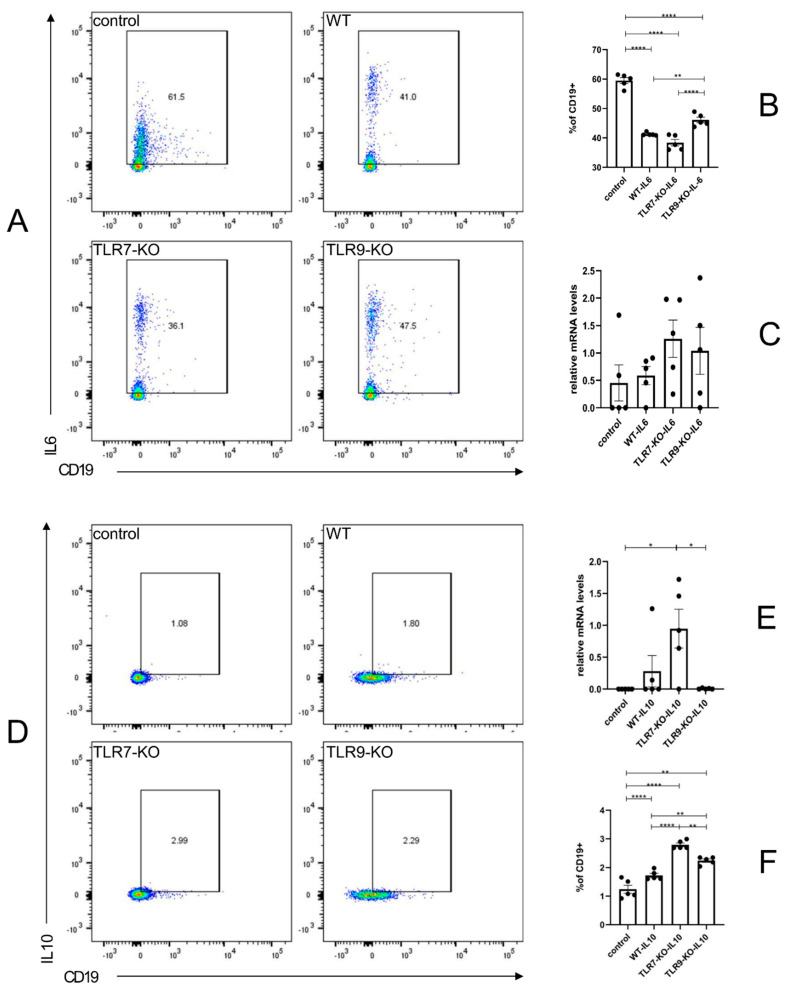
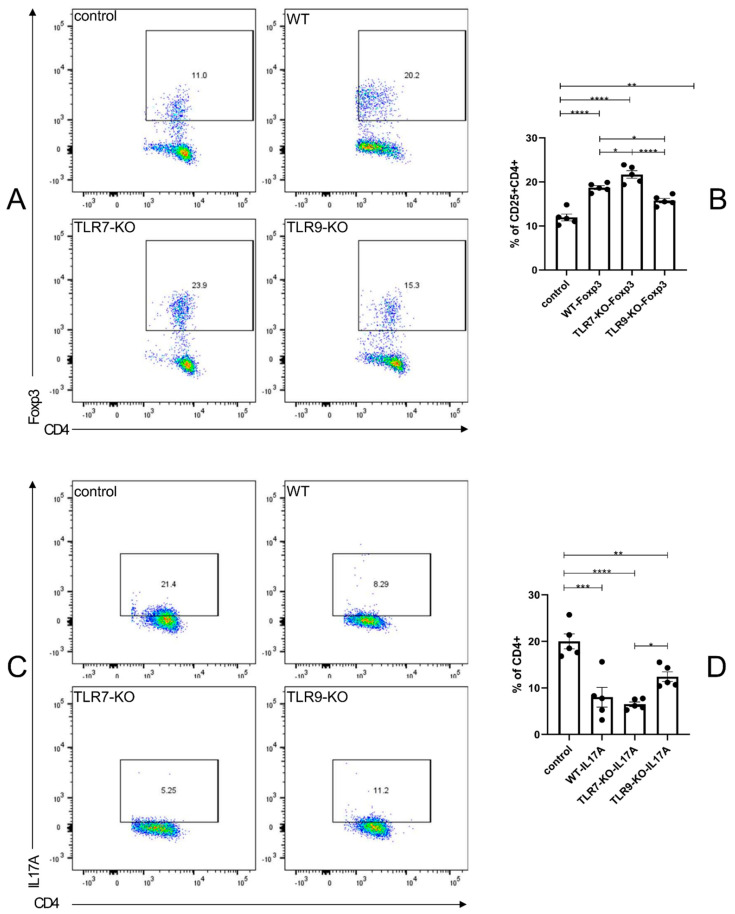
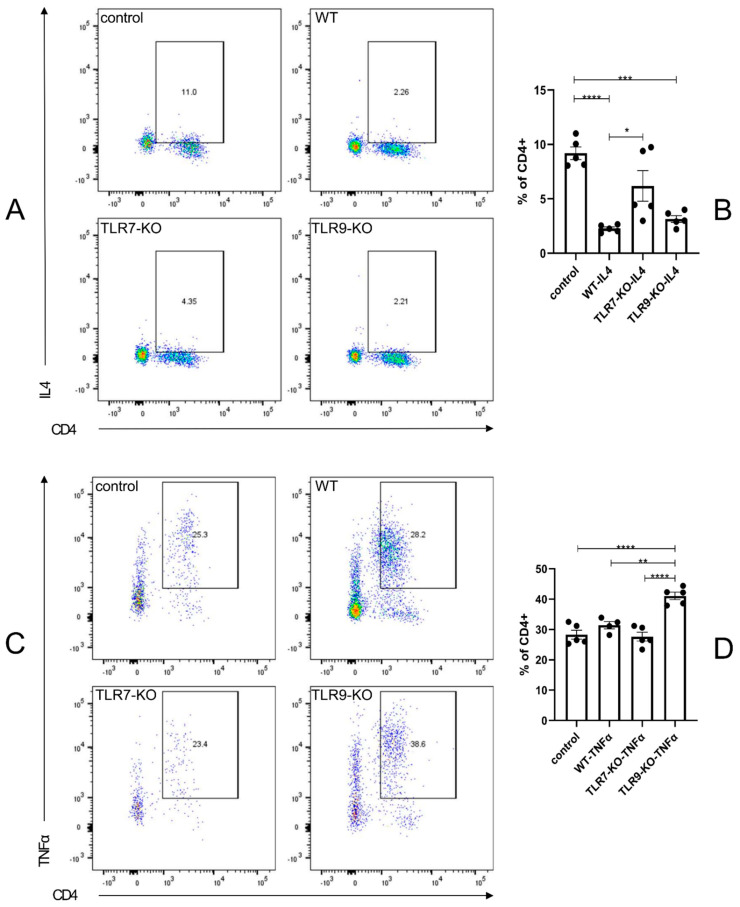
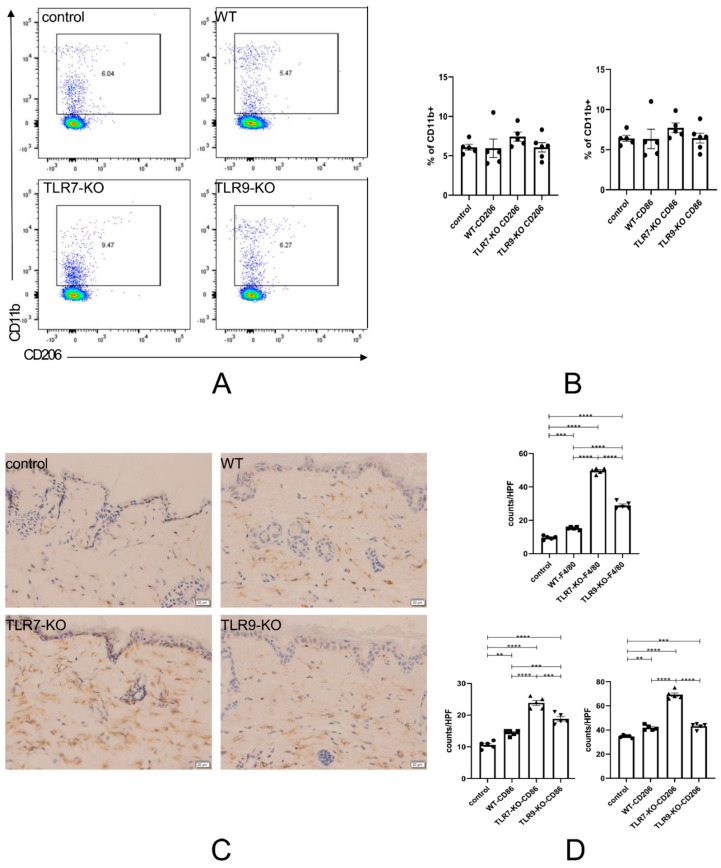
The bleomycin-induced scleroderma model is a well-established and dependable method for creating a mouse model of SSc (systemic sclerosis). In the field of skin connective tissue diseases, increasing evidence from clinical and animal experiments suggests that TLRs (Toll-like receptors) play an important role in several diseases. This study aimed to determine the role of TLR7 (Toll-like receptor 7) and TLR9 (Toll-like receptor 9) in the mechanisms of immune abnormalities and fibrosis in SSc. This study used TLR7-KO mice (TLR7-knockout mice with a balb/c background) and TLR9-KO mice (TLR9-knockout mice with a balb/c background) as well as WT mice (wild-type balb/c mice). All three kinds of mice were induced by BLM (bleomycin) in a scleroderma model as the experimental group; meanwhile, WT mice treated with PBS (phosphate-buffered saline) were used as the control group. We analyzed the fibrotic phenotype and the immunological abnormality phenotype of TLR7-deficient and TLR9-deficient mice in the SSc disease model using flow cytometry, RT-PCR (reverse transcription-polymerase chain reaction), a histological examination, and IHC (immunohistochemical staining). In a mouse model of SSc disease, the deletion of TLR7 attenuated skin and lung fibrosis, while the deletion of TLR9 exacerbated skin and lung fibrosis. The deletion of TLR7 resulted in a relative decrease in the infiltration and expression of various pro-inflammatory and fibrotic cells and cytokines in the skin. On the other hand, the deletion of TLR9 resulted in a relative increase in the infiltration and expression of various pro-inflammatory and cytokine-inhibiting cells and cytokines in the skin. Under the influence of pDCs (plasmacytoid dendritic cells), the balances of Beff/Breg (IL-6 + CD19 + B cell/IL-10 + CD19 + B cell), Th17/Treg (IL-17A + CD4 + T cell/Foxp3 + CD25 + CD4 + T cell), M1/M2 (CD86 + macrophage/CD206 + macrophage), and Th1/Th2 (TNFα + CD3 + CD4 + T cell/IL-4 + CD3 + CD4 + T cell) were biased towards the suppression of inflammation and fibrosis as a result of the TLR7 deletion. Comparatively, the balance was biased towards promoting inflammation and fibrosis due to the TLR9 deletion. In the SSc model, TLR7 promoted inflammation and fibrosis progression, while TLR9 played a protective role. These results suggest that TLR7 and TLR9 play opposite roles in triggering SSc to produce immune system abnormalities and skin fibrosis.

Keywords: B cells; Effector B cells; Regulatory B cells; TLR7; TLR9; Th17; Toll-like receptors; Treg; pDCs; plasmacytoid dendritic cells; systemic sclerosis.


Conflict of interest statement

The authors have declared no conflicts of interest.

Figures

Figure 1
Figure 1
(A) Examples of Masson’s trichrome-stained skin tissue sections. The scale bars are all 50 μm. The dermal thicknesses in the blue sections were all measured at the same location, as indicated by the red scale bar. (B) The left panel corresponds to a bar chart of the dermal thickness of each mouse skin. The right panel shows the mRNA expression of TGFβ in the skin. (C) Immunohistochemical sections of αSMA-positive cell infiltration in the skin. The red part is αSMA-positive cells. The scale bars are all 20 μm. (D) Bar graphs of each type of mouse, corresponding to the C graph. (E): Example of a section of mouse lung tissue stained with Masson’s trichrome. All are microscopic images of the same site in the lower lateral part of the left lung. The scale bars are all 50 μm. (F) The degree of fibrosis in the (E) was quantified by using the Ashcroft Score and made into a bar chart. * = p < 0.05, ** = p < 0.01, *** = p < 0.001, and **** = p < 0.0001 for each type of mouse in each type of experiment, with a sample size of 4–5 mice. The bar denotes the mean SEM. The name of each type of mouse is shown in the upper left-hand corner of each example figure.
Figure 2
Figure 2
(A) Flow cytometry results from an independent experiment, reflecting the proportion of CD11c-staining-positive cells with positive PDCA-1 staining. (B) Bar graphs for each mouse species, corresponding to the left panel. **** = p < 0.0001 for each type of mouse in each type of experiment, with a sample size of 4–5 mice. The bar denotes the mean SEM. The name of each type of mouse is shown in the upper left corner of each example graph.
Figure 3
Figure 3
(A) Flow cytometry results, reflecting the proportion of cells positive for IL-6 staining in an independent experiment. (B) Bar graphs of CD19 + IL6 + for each mouse species, corresponding to (A). (C) The mRNA expression of IL-6 in skin tissue. (D) The flow cytometry results, reflecting the proportion of IL-10 staining in CD19-positive cells in an independent experiment. (E) The mRNA expression of IL-10 in skin tissue. (F) Bar graphs for each type of mouse corresponding to the graph. * = p < 0.05, ** = p < 0.01, and **** = p < 0.0001 for each type of mouse in each type of experiment, with sample sizes of 4–5 mice. The bar denotes the mean SEM. The name of each type of mouse is shown in the upper left corner of each example graph.
Figure 4
Figure 4
(A) Flow cytometry results, reflecting the proportion of cells positive for Foxp3 staining in an independent experiment with positive CD4 and CD25 staining. (B) Bar graphs for each mouse species, corresponding to (A). (C) The flow cytometry results, reflecting the proportion of IL-17A-positive cells in CD4-positive cells in an independent experiment. (D) Corresponding bar charts for each mouse species. * = p < 0.05, ** = p < 0.01, *** = p < 0.001, and **** = p < 0.0001 for each type of mouse in each type of experiment, with sample sizes of 4–5 mice. The bar denotes the mean SEM. The name of each type of mouse is shown in the upper left corner of each example graph.
Figure 5
Figure 5
(A) Flow cytometry results, reflecting the proportion of cells positive for IL-4 staining in an independent experiment. (B) Bar charts for each mouse species, corresponding to (A). (C) The flow cytometry results, reflecting the proportion of CD4-positive cells staining positive for TNFα in an independent experiment. (D) Corresponding bar charts for each mouse species. * = p < 0.05, ** = p < 0.01, *** = p < 0.001, and **** = p < 0.0001 for each type of mouse in each type of experiment, with sample sizes of 4–5 mice. The bar denotes the mean SEM. The name of each type of mouse is shown in the upper left corner of each example graph.
Figure 6
Figure 6
(A) Flow cytometry results, reflecting the proportion of CD206-positive cells in an experiment with CD11b-positive cells. (B) The left panel shows the bar graph corresponding to (A). The right panel shows the flow cytometry results, reflecting the proportion of CD86-positive cells in the same experiment. The right panel shows the bar graph corresponding to the flow cytometry results, reflecting the proportion of CD86-positive cells in the same experiment. (C) An example of an immunohistochemical section of skin infiltrated with F4/80-positive cells. (D) The upper panel is the bar chart corresponding to (C) for each type of mouse skin. In the lower left and lower right are bars reflecting the infiltration of CD86-positive cells and CD206-positive cells in the skin of each of the four mouse species, respectively. ** = p < 0.01, *** = p < 0.001, and **** = p < 0.0001 for each type of mouse in each type of experiment, with a sample size of 4–5 mice. The bar denotes the mean SEM. The name of each type of mouse is shown in the upper left corner of each example plot.

Similar articles

Cited by

References

    1. Asano Y. Systemic sclerosis. J. Dermatol. 2018;45:128–138. doi: 10.1111/1346-8138.14153. - DOI - PubMed
    1. Wight T., Frevert C., Debley J., Reeves S., Parks W., Ziegler S. Interplay of extracellular matrix and leukocytes in lung inflammation. Cell. Immunol. 2017;312:1–14. doi: 10.1016/j.cellimm.2016.12.003. - DOI - PMC - PubMed
    1. Takahashi N., Sugaya M., Suga H., Oka T., Kawaguchi M., Miyagaki T., Fujita H., Sato S. Thymic Stromal Chemokine TSLP Acts through Th2 Cytokine Production to Induce Cutaneous T-cell Lymphoma. Cancer Res. 2016;76:6241–6252. doi: 10.1158/0008-5472.CAN-16-0992. - DOI - PubMed
    1. Yamada T., Ogi K., Sakashita M., Kanno M., Kubo S., Ito Y., Imoto Y., Tokunaga T., Okamoto M., Narita N., et al. Toll-like receptor ligands induce cytokine and chemokine production in human inner ear endolymphatic sac fibroblasts. Auris Nasus Larynx. 2017;44:398–403. doi: 10.1016/j.anl.2016.10.007. - DOI - PubMed
    1. Yamamoto T. Animal model of systemic sclerosis. J. Dermatol. 2010;37:26–41. doi: 10.1111/j.1346-8138.2009.00764.x. - DOI - PubMed

MeSH terms