. 2024 Jun 2;25(11):6138.
doi: 10.3390/ijms25116138.

Orthologs of NOX5 and EC-SOD/SOD3: dNox and dSod3 Impact Egg Hardening Process and Egg Laying in Reproductive Function of Drosophila melanogaster

Affiliations

Orthologs of NOX5 and EC-SOD/SOD3: dNox and dSod3 Impact Egg Hardening Process and Egg Laying in Reproductive Function of Drosophila melanogaster

Eva Louise Steinmetz et al. Int J Mol Sci. .

Abstract

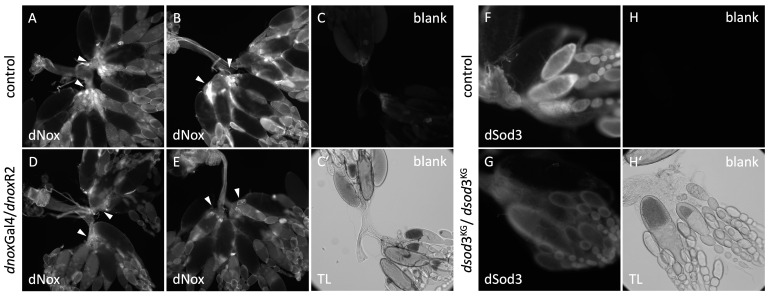
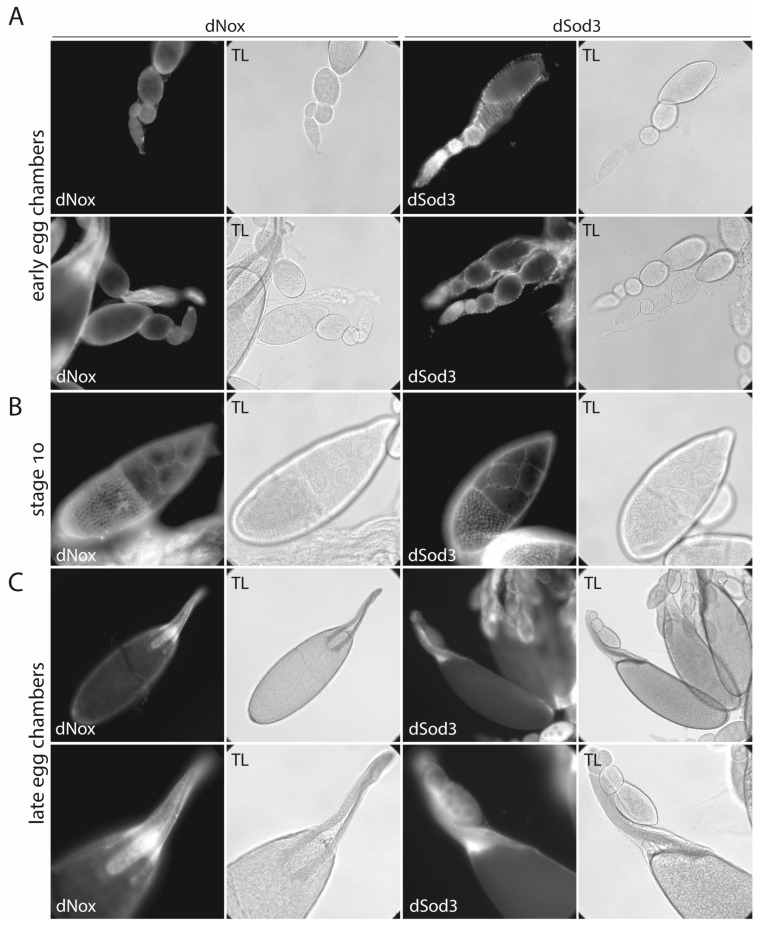
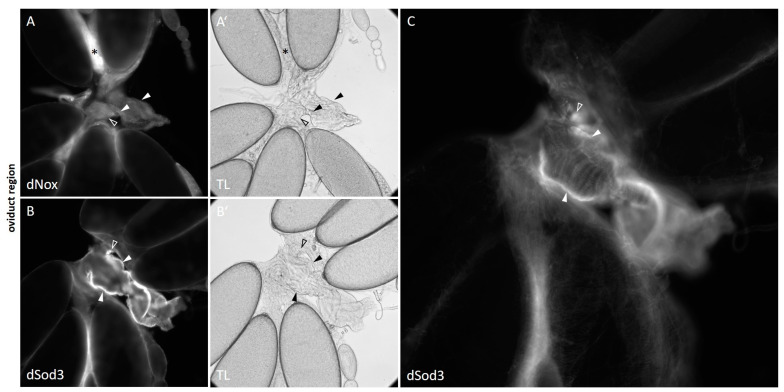
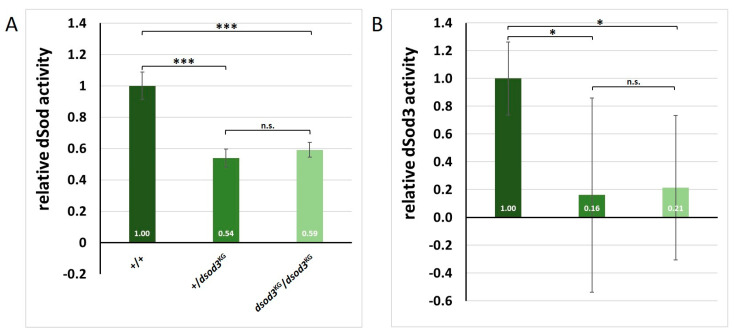
The occurrence of ovarian dysfunction is often due to the imbalance between the formation of reactive oxygen species (ROS) and the ineffectiveness of the antioxidative defense mechanisms. Primary sources of ROS are respiratory electron transfer and the activity of NADPH oxidases (NOX) while superoxide dismutases (SOD) are the main key regulators that control the levels of ROS and reactive nitrogen species intra- and extracellularly. Because of their central role SODs are the subject of research on human ovarian dysfunction but sample acquisition is low. The high degree of cellular and molecular similarity between Drosophila melanogaster ovaries and human ovaries provides this model organism with the best conditions for analyzing the role of ROS during ovarian function. In this study we clarify the localization of the ROS-producing enzyme dNox within the ovaries of Drosophila melanogaster and by a tissue-specific knockdown we show that dNox-derived ROS are involved in the chorion hardening process. Furthermore, we analyze the dSod3 localization and show that reduced activity of dSod3 impacts egg-laying behavior but not the chorion hardening process.

Keywords: (extracellular) superoxide dismutase (EC-SOD or SOD3); NADPH oxidase 5 (NOX5).


Conflict of interest statement

The authors declare no conflicts of interest.

Figures

Figure 1
Figure 1
Western blot analysis of whole ovary homogenates with (A): anti-dNox antibody (1:500; this work) and (B): anti-dSod3 antibody (1:500; #PA5-102904 Invitrogen). The amount of probes is equivalent to 0.25, 0.5, or 1 ovary; α-tubulin was used as a loading control; probes were run on a 7% SDS-PAGE when analyzing dNox and on a 12% SDS-PAGE when analyzing dSod3 (optimized for protein size). (C): Alignment of the amino acid sequences that were used as immunogen for the generation of the antibody against Drosophila NADPH oxidase (dNox) (black letters) against the amino acid sequence of the second Drosophila (dual specific) NADPH oxidase (dDuox) (in grey) (D): Alignment of the amino acid sequences of Drosophila superoxide dismutase 3 (dSod3) (black letters), human superoxide dismutase 3 (hSOD3), mouse superoxide dismutase 3 (mSod3), and the two remaining Drosophila superoxide dismutase isoforms 1 and 2 (dSod2 and dSod2) (in grey). Asterisks mark amino acid residues that are conserved between dSod3, hSOD3, and mSod3.
Figure 2
Figure 2
Immunostaining on fixed ovaries with anti-dNox antibody (1:250) and anti-dSod3 antibody (1:250) (A,B): control ovaries (without RNAi induction; +/UASdnoxR2). (D,E): ovaries with RNAi-downregulated dnox expression (dnoxGal4(BL78988)/UASdnoxR2(BL32902)). Arrowheads point to regions of reduced dNox signal compared with control. (C,C′): technical control without primary antibody (blank) on control ovaries. TL transmitted light image of the blank. Fluorescence images were taken under identical microscope settings and were processed the same. (F): control ovary (+/+) and (G): ovary of the homozygous (dsod3KG/dsod3KG) mutant. (H,H′): technical control without primary antibody (blank) on (+/+) ovaries. TL transmitted light image of the blank. Fluorescence images were taken under identical microscope settings and were processed the same.
Figure 3
Figure 3
Comparison of dNox and dSod3 localization by immunohistochemistry. (A): early egg chambers, (B): stage 10 egg chambers, and (C): late stages of egg chamber development. (A): dNox localization (left panel) and dSod3 localization (right panel) in early egg chambers. (B): dNox localization (left panel) and dSod3 localization (right panel) in stage 10 egg chambers. (C): dNox localization (left panel) and dSod3 localization (right panel) in the anterior region of late egg chambers. All fluorescent images are accompanied by the respective transmitted light (TL) images for better identification of all structures. Indirect immunostaining was done using anti-dNox (1:250; this work) or anti-dSod3 (1:250; #PA5-102904 Invitrogen) antibodies combined with fluorophore-coupled (Cy3 or Cy5) secondary antibodies on fixed ovaries.
Figure 4
Figure 4
dNox and dSod3 localization in stage 9–10 egg chambers. (A,B): dNox localization (cross-section focus in (A) and surface focus in (B) in stage 10 egg chamber and (C,D): dSod3 localization (cross-section focus in (C) and surface focus in (D)) in stage 9 egg chamber; focus was set to the follicle cell epithel that surrounds the growing oocyte. Indirect immunostaining was done using anti-dNox (1:250; this work) or anti-dSod3 (1:250; #PA5-102904 Invitrogen) antibodies combined with fluorophore-coupled (Cy3 or Cy5) secondary antibodies on fixed ovaries.
Figure 5
Figure 5
dNox and dSod3 localization in the oviduct. Oviducts of wild-type females were immunostained with: (A,A′) anti-dNox antibody (1:250; this work) and (B,B′): anti-dSod3 antibody (1:250; #PA5-102904 Invitrogen) combined with fluorophore-coupled secondary antibodies on fixed ovaries. Fluorescent images are accompanied by the respective transmitted light (TL) images for better identification of all structures. Filled arrowheads point to the common oviduct, and unfilled arrowheads depict parts of the lateral oviducts. While (A,B) show a cross-section focus, (C) shows a magnified and surface-focused view from (B) for a more detailed representation of the dSod3 localization in the common oviduct area. Asterisks in (A,A′) mark a corpus luteum (CL).
Figure 6
Figure 6
Diminished level of dsod3 has an impact on ovary function and egg-laying. (AF): abdominal morphology, (A′F′): ovary morphology, and (A″F″): laid egg morphology. First lane: control (+/+) compared with females with diminished gene doses of dsod3: heterozygous mutant (+/dsod3KG) and homozygous mutant (dsod3KG/dsod3KG). Second lane: control without RNAi induction (+/dsod3R2) compared with females with ubiquitously (actGal4/dsod3R2) or ovarian-specific (OvGal4/dsod3R2) downregulated dsod3. (G,H): egg laying rates (per female per 24 h) of different genotypes with diminished dsod3 level (n ≥ 20 females for each genotype). (I,J): hatching rates of the different genotypes with diminished DSOD3 level (n = 3). Error bars in E and F mark the standard deviation (s.d.). An unpaired t-test provided information about significance. * = p-value ≤ 0.05; ** = p-value ≤ 0.01; *** = p-value ≤ 0.001; n.s. = not significant.
Figure 7
Figure 7
Diminished levels of dnox have an impact on ovary function, egg laying, and chorion development. (AD): abdominal morphology is enlarged in females with ubiquitously (actGal4/dnoxR2) or ovarian-specific (OvGal4/dnoxR2) downregulated dnox compared with the controls (actGal4/+ and OvGal4/+). (A′D′): Ovaries with ubiquitously (actGal4/dnoxR2) or ovarian-specific (OvGal4/dnoxR2) downregulated dnox are enlarged and contain more late-stage egg chambers compared with their controls (actGal4/+ and OvGal4/+). (A″D″): Naturally laid eggs from females with ubiquitously (actGal4/dnoxR2) or ovarian-specific downregulated dnox (OvGal4/dnoxR2) are smaller and show dysmorphic chorion structures compared with the morphology control (actGal4/+ and OvGal4/+). (E): egg laying rates per female per 24 h of different genotypes with diminished dnox level (n ≥ 25 females for each genotype) (F): hatching rates of the different genotypes with diminished dnox levels (n = 3). Error bars in (E) and (F) mark the standard deviation (s.d.). An unpaired t-test provided information about significance. *** = p-value ≤ 0.001.
Figure 8
Figure 8
Chorion dysmorphology in dnox-downregulated ovaries. (A): control ovary (+/dsod3R1), (B): ovary with ovarian-specific downregulation of dsod3 (OvGal4/dsod3R1), and (C): control ovary (OvGal4/+) show fluorescence signals at chorion structures (white arrowheads). (D): ovary with ovarian-specific (OvGal4/dnoxR1) downregulation of dnox. All ovaries were tested for intrinsic fluorescence signals after excitation at 470 nm and with a GFP-specific emission filter set. White arrowheads point to the dorsal appendages of the chorion, and unfilled white arrowheads point to the yolk of mature egg chambers. Scale bars: 100 µm.
Figure 9
Figure 9
Total dSod activity compared with extracellular dSod3 activity in Drosophila ovaries. (A): Relative dSod enzyme activity within ovary homogenates of the control (+/+), the heterozygous mutant (+/dsod3KG), and the homozygous mutant (dsod3KG/dsod3KG); n = 5 for each genotype. (B): Relative extracellular dSod3 activity from intact ovaries of control (+/+), the heterozygous mutant (+/dsod3KG), and the homozygous mutant (dsod3KG/dsod3KG); n = 8 to 10 for each genotype. Values are normalized to control. Error bars in (A,B) mark the standard deviation (s.d.). An unpaired t-test provided information about significance. * = p-value ≤ 0.05; *** = p-value ≤ 0.001; n.s. = not significant.
Figure 10
Figure 10
Endogenous H2O2 levels reduced in the ovaries of the dsod3KG mutant. (A) Relative H2O2 level in whole ovaries measured by a genetically encoded roGFP2-Orp1-H2O2-sensor in a plate reader (n = 55 per genotype) (B): Relative H2O2 level in different stages of egg chamber development measured on a fluorescent microscope (n ≥ 30 for each genotype and egg chamber stage) (C): Example of egg chambers expressing the sensor molecule. Fluorescence was excited at 470 nm and at 405 nm and was always detected at 500–550 nm. The ratio of both values reveals the oxidation status of the sensor molecule (and therefore the relative H2O2 level). Error bars in (A,B) mark the standard deviation (s.d.). An unpaired t-test provided information about significance. ** = p-value ≤ 0.01; *** = p-value ≤ 0.001.

Similar articles

Cited by

References

    1. D’Autréaux B., Toledano M.B. ROS as Signalling Molecules: Mechanisms That Generate Specificity in ROS Homeostasis. Nat. Rev. Mol. Cell Biol. 2007;8:813–824. doi: 10.1038/nrm2256. - DOI - PubMed
    1. Finkel T. Signal Transduction by Reactive Oxygen Species. J. Cell Biol. 2011;194:7–15. doi: 10.1083/jcb.201102095. - DOI - PMC - PubMed
    1. Sies H., Belousov V.V., Chandel N.S., Davies M.J., Jones D.P., Mann G.E., Murphy M.P., Yamamoto M., Winterbourn C. Defining Roles of Specific Reactive Oxygen Species (ROS) in Cell Biology and Physiology. Nat. Rev. Mol. Cell Biol. 2022;23:499–515. doi: 10.1038/s41580-022-00456-z. - DOI - PubMed
    1. Sies H., Jones D.P. Reactive Oxygen Species (ROS) as Pleiotropic Physiological Signalling Agents. Nat. Rev. Mol. Cell Biol. 2020;21:363–383. doi: 10.1038/s41580-020-0230-3. - DOI - PubMed
    1. Sugino N. Reactive Oxygen Species in Ovarian Physiology. Volume 4 Wiley; New York, NY, USA: 2005. - PMC - PubMed

LinkOut - more resources