

Zebrafish as a Human Muscle Model for Studying Age-Dependent Sarcopenia and Frailty
- PMID: 38892357
- PMCID: PMC11172448
- DOI: 10.3390/ijms25116166
Zebrafish as a Human Muscle Model for Studying Age-Dependent Sarcopenia and Frailty
Abstract
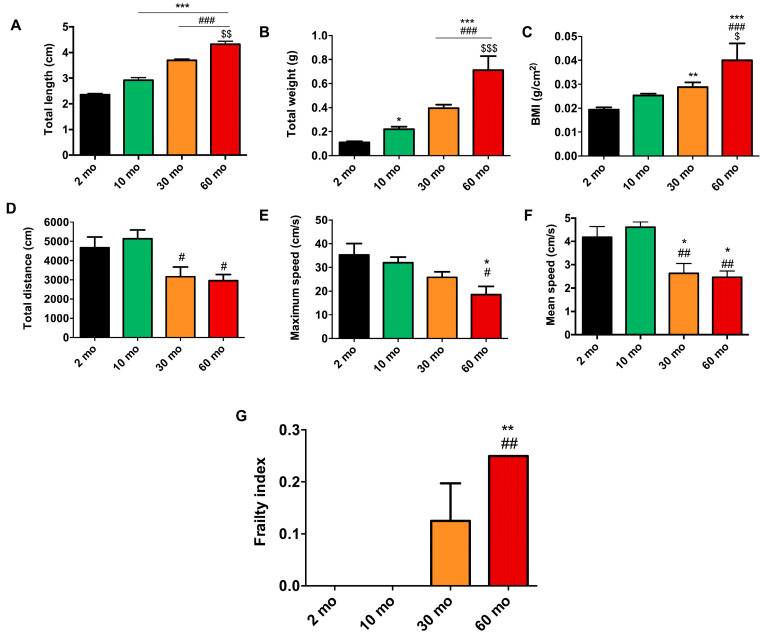
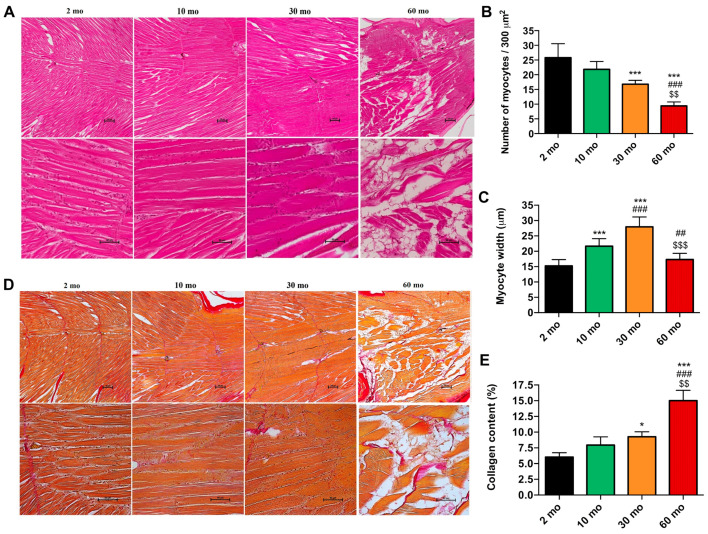
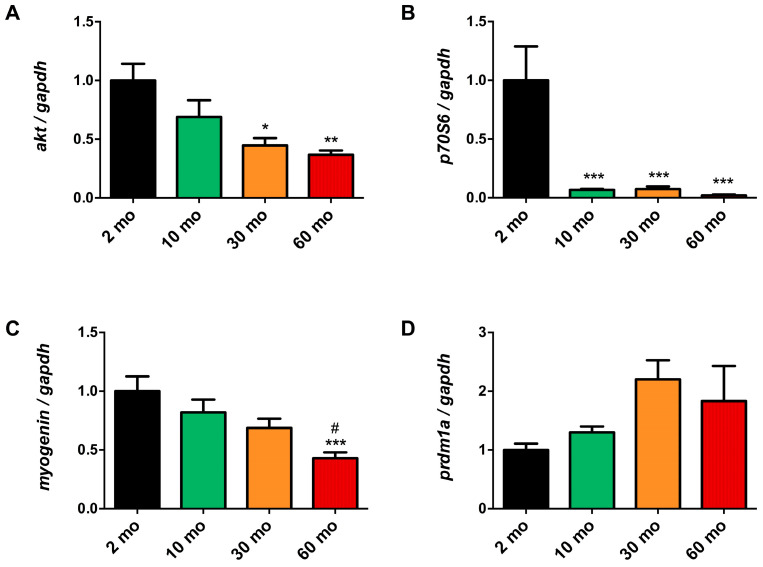
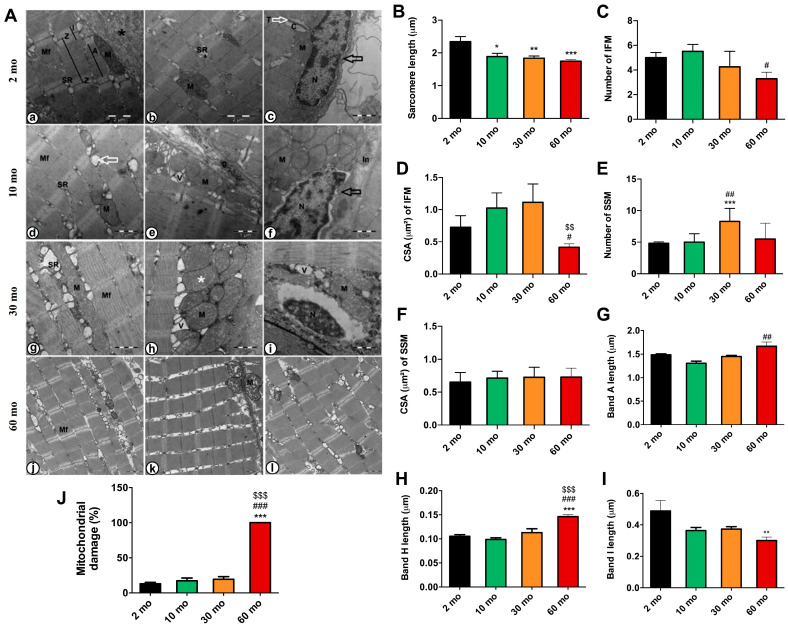
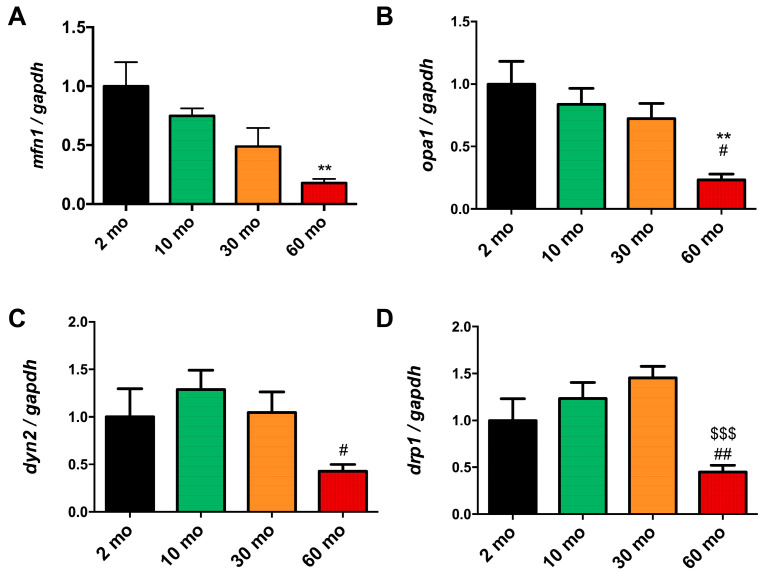
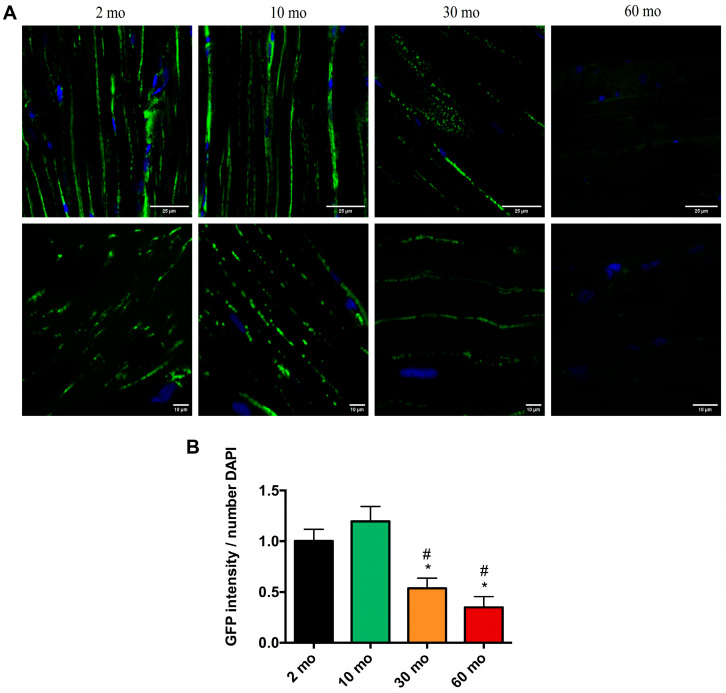
Currently, there is an increase in the aging of the population, which represents a risk factor for many diseases, including sarcopenia. Sarcopenia involves progressive loss of mass, strength, and function of the skeletal muscle. Some mechanisms include alterations in muscle structure, reduced regenerative capacity, oxidative stress, mitochondrial dysfunction, and inflammation. The zebrafish has emerged as a new model for studying skeletal muscle aging because of its numerous advantages, including histological and molecular similarity to human skeletal muscle. In this study, we used fish of 2, 10, 30, and 60 months of age. The older fish showed a higher frailty index with a value of 0.250 ± 0.000 because of reduced locomotor activity and alterations in biometric measurements. We observed changes in muscle structure with a decreased number of myocytes (0.031 myocytes/μm2 ± 0.004 at 60 months) and an increase in collagen with aging up to 15% ± 1.639 in the 60-month group, corresponding to alterations in the synthesis, degradation, and differentiation pathways. These changes were accompanied by mitochondrial alterations, such as a nearly 50% reduction in the number of intermyofibrillar mitochondria, 100% mitochondrial damage, and reduced mitochondrial dynamics. Overall, we demonstrated a similarity in the aging processes of muscle aging between zebrafish and mammals.
Keywords: aging; mitochondria; sarcopenia; skeletal muscle; zebrafish.
Conflict of interest statement
The authors declare no competing interests.
Figures
Similar articles
-
Nrf2 deficiency exacerbates frailty and sarcopenia by impairing skeletal muscle mitochondrial biogenesis and dynamics in an age-dependent manner.Exp Gerontol. 2019 May;119:61-73. doi: 10.1016/j.exger.2019.01.022. Epub 2019 Jan 25. Exp Gerontol. 2019. PMID: 30690066
-
Frailty and sarcopenia as the basis for the phenotypic manifestation of chronic diseases in older adults.Mol Aspects Med. 2016 Aug;50:1-32. doi: 10.1016/j.mam.2016.06.001. Epub 2016 Jun 28. Mol Aspects Med. 2016. PMID: 27370407 Review.
-
Aerobic exercise enhances mitochondrial homeostasis to counteract D-galactose-induced sarcopenia in zebrafish.Exp Gerontol. 2023 Sep;180:112265. doi: 10.1016/j.exger.2023.112265. Epub 2023 Jul 29. Exp Gerontol. 2023. PMID: 37482108
-
Basic Science of Frailty-Biological Mechanisms of Age-Related Sarcopenia.Anesth Analg. 2021 Feb 1;132(2):293-304. doi: 10.1213/ANE.0000000000005096. Anesth Analg. 2021. PMID: 32769382 Review.
-
Role of Age-Related Mitochondrial Dysfunction in Sarcopenia.Int J Mol Sci. 2020 Jul 23;21(15):5236. doi: 10.3390/ijms21155236. Int J Mol Sci. 2020. PMID: 32718064 Free PMC article. Review.
Cited by
-
Preparation of Rutin-Whey Protein Pickering Emulsion and Its Effect on Zebrafish Skeletal Muscle Movement Ability.Nutrients. 2024 Sep 10;16(18):3050. doi: 10.3390/nu16183050. Nutrients. 2024. PMID: 39339650 Free PMC article.
-
Hidden pathway: the role of extracellular matrix in type 2 diabetes mellitus-related sarcopenia.Front Endocrinol (Lausanne). 2025 Apr 16;16:1560396. doi: 10.3389/fendo.2025.1560396. eCollection 2025. Front Endocrinol (Lausanne). 2025. PMID: 40309438 Free PMC article. Review.
-
Accelerated Sarcopenia Phenotype in the DJ-1/Park7-Knockout Zebrafish.Antioxidants (Basel). 2024 Dec 11;13(12):1509. doi: 10.3390/antiox13121509. Antioxidants (Basel). 2024. PMID: 39765837 Free PMC article.
-
Modeling Musculoskeletal Disorders in Zebrafish: Advancements in Muscle and Bone Research.Cells. 2024 Dec 30;14(1):28. doi: 10.3390/cells14010028. Cells. 2024. PMID: 39791729 Free PMC article. Review.
-
The Organ-Joint Axes in Osteoarthritis: Significant Pathogenesis and Therapeutic Targets.Aging Dis. 2024 Nov 21;16(5):2999-3021. doi: 10.14336/AD.2024.1223. Aging Dis. 2024. PMID: 39656496 Free PMC article. Review.
References
-
- Rogeri P.S., Zanella R., Martins G.L., Garcia M.D.A., Leite G., Lugaresi R., Gasparini S.O., Sperandio G.A., Ferreira L.H.B., Souza-Junior T.P., et al. Strategies to Prevent Sarcopenia in the Aging Process: Role of Protein Intake and Exercise. Nutrients. 2021;14:52. doi: 10.3390/nu14010052. - DOI - PMC - PubMed
-
- Sayed R.K.A., de Leonardis E.C., Guerrero-Martínez J.A., Rahim I., Mokhtar D.M., Saleh A.M., Abdalla K.E.H., Pozo M.J., Escames G., López L.C., et al. Identification of Morphological Markers of Sarcopenia at Early Stage of Aging in Skeletal Muscle of Mice. Exp. Gerontol. 2016;83:22–30. doi: 10.1016/j.exger.2016.07.007. - DOI - PubMed
MeSH terms
Grants and funding
LinkOut - more resources
Full Text Sources
Medical
Molecular Biology Databases
