. 2024 Jun 5;25(11):6207.
doi: 10.3390/ijms25116207.

Arrhythmogenic Ventricular Remodeling by Next-Generation Bruton's Tyrosine Kinase Inhibitor Acalabrutinib

Affiliations

Arrhythmogenic Ventricular Remodeling by Next-Generation Bruton's Tyrosine Kinase Inhibitor Acalabrutinib

Yanan Zhao et al. Int J Mol Sci. .

Abstract

Cardiac arrhythmias remain a significant concern with Ibrutinib (IBR), a first-generation Bruton's tyrosine kinase inhibitor (BTKi). Acalabrutinib (ABR), a next-generation BTKi, is associated with reduced atrial arrhythmia events. However, the role of ABR in ventricular arrhythmia (VA) has not been adequately evaluated. Our study aimed to investigate VA vulnerability and ventricular electrophysiology following chronic ABR therapy in male Sprague-Dawley rats utilizing epicardial optical mapping for ventricular voltage and Ca2+ dynamics and VA induction by electrical stimulation in ex-vivo perfused hearts. Ventricular tissues were snap-frozen for protein analysis for sarcoplasmic Ca2+ and metabolic regulatory proteins. The results show that both ABR and IBR treatments increased VA vulnerability, with ABR showing higher VA regularity index (RI). IBR, but not ABR, is associated with the abbreviation of action potential duration (APD) and APD alternans. Both IBR and ABR increased diastolic Ca2+ leak and Ca2+ alternans, reduced conduction velocity (CV), and increased CV dispersion. Decreased SERCA2a expression and AMPK phosphorylation were observed with both treatments. Our results suggest that ABR treatment also increases the risk of VA by inducing proarrhythmic changes in Ca2+ signaling and membrane electrophysiology, as seen with IBR. However, the different impacts of these two BTKi on ventricular electrophysiology may contribute to differences in VA vulnerability and distinct VA characteristics.

Keywords: acalabrutinib; action potential; calcium cycling; electrical remodeling; ibrutinib; ventricular arrhythmia.


Conflict of interest statement

The authors declare no conflicts of interest.

Figures
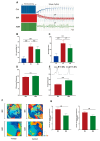
Figure 1
Figure 1
Effects of Ibrutinib (IBR) and Acalabrutinib (ABR) on ventricular arrhythmia (VA) vulnerability and characteristics. (A) Representative pseudo-electrogram (pseudo-ECGs) after VA inductions in the heart of control (Ctrl) and IBR- and ABR-treated rats. (B) VA inducibility and (C) VA burden in the ABR-treated group were higher compared to control but lower than those in the IBR-treated group (n = 10 in each group; p-value: Kruskal–Wallis test). (D) Dominant Frequencies (DF) of induced VA were similar in the IBR- and ABR-treated groups (n = 7 in each group; p-value: t-test). (E) The Regularity Index (RI) of induced VA was higher in the ABR-treated group compared to the IBR-treated group. Representative (a) IBR and (b) ABR frequency distribution during VA (n = 7 in each group; p-value: t-test). (F) Illustrative voltage and calcium phase mapping during VA in the hearts from IBR- and ABR-treated rats. Scale bar: 20 mm. (G) Number of membrane voltage and calcium wavefronts per frame during early (10 s) and late (10 s) VAs in IBR and ABR groups (n = 7–8 in each group; p-value: Kruskal–Wallis test or t-test).
Figure 2
Figure 2
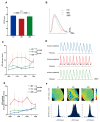
Effects of IBR and ABR on ventricular electrophysiology. (A) IBR, but not ABR, treatment was associated with reduced action potential duration (APD) at 80% repolarization (APD80) (n = 10 at each group; p-value: t-test). (B) Representative traces of action potential at 10 Hz. (C) APD alternans was higher with IBR therapy, but not with ABR therapy. (D) Representative tracings with increased APD alternans from an IBR-treated heart and reduced APD alternans from Ctrl and ABR hearts at a pacing rate of 11.0 Hz. (E) IBR increased APD spatial discordance alternans. (F) Representative maps showing dispersion of APD80, with color code, at 12 Hz. Histograms showing the distributions of ΔAPD across the LV epicardial mapping area, 12 Hz pacing (x-axis: ΔAPD [ms]; y-axis: the number of points from the ΔAPD map) (n = 8–10; p-value: two-way repeated ANOVA). (G)Epicardial conduction velocity (CV) was lower with IBR and ABR treatments. (H) Representative successive isochronal conduction maps with 10 Hz pacing. Red arrows show the pacing location. (I) CV dispersion was higher with IBR and ABR therapies. (J) Representative color maps showing CV dispersion in different groups during 10 Hz pacing. The arrows indicates the conduction direction. (CJ: n = 8–10 in each group; p-value: two-way repeated ANOVA).
Figure 2
Figure 2
Effects of IBR and ABR on ventricular electrophysiology. (A) IBR, but not ABR, treatment was associated with reduced action potential duration (APD) at 80% repolarization (APD80) (n = 10 at each group; p-value: t-test). (B) Representative traces of action potential at 10 Hz. (C) APD alternans was higher with IBR therapy, but not with ABR therapy. (D) Representative tracings with increased APD alternans from an IBR-treated heart and reduced APD alternans from Ctrl and ABR hearts at a pacing rate of 11.0 Hz. (E) IBR increased APD spatial discordance alternans. (F) Representative maps showing dispersion of APD80, with color code, at 12 Hz. Histograms showing the distributions of ΔAPD across the LV epicardial mapping area, 12 Hz pacing (x-axis: ΔAPD [ms]; y-axis: the number of points from the ΔAPD map) (n = 8–10; p-value: two-way repeated ANOVA). (G)Epicardial conduction velocity (CV) was lower with IBR and ABR treatments. (H) Representative successive isochronal conduction maps with 10 Hz pacing. Red arrows show the pacing location. (I) CV dispersion was higher with IBR and ABR therapies. (J) Representative color maps showing CV dispersion in different groups during 10 Hz pacing. The arrows indicates the conduction direction. (CJ: n = 8–10 in each group; p-value: two-way repeated ANOVA).
Figure 3
Figure 3
Effects of IBR and ABR on ventricular calcium cycling. (A) There were no differences in calcium transient (CaT) upstroke rise with IBR and ABR treatments. (B) Representative traces of CaT upstroke rise at 10 Hz. (C) The decay time constant of CaT was larger with IBR and ABR treatments. (D) Representative CaTs at 10 Hz. The decay portion of the CaT is marked as a black curve. (E) IBR, but not ABR, treatment was associated with significantly a greater spontaneous calcium elevation (SCaE). (F) Representative traces of SCaE during 11 Hz pacing. (a–c) Indications of optical tracing and color maps of intracellular calcium (Cai) and membrane voltage (Vm), respectively. (b) SCaE (red arrows) and delayed after–depolarization (DAD) (black arrowhead) were elicited at the cessation of rapid pacing in the heart of IBR–treated rats. Optical images were captured from the sites labeled by asterisks in Cai and Vm maps. (G) More calcium alternans is observed with IBR and ABR treatments. (H) Color maps of calcium alternans and corresponding CaT traces at 12 Hz, a,b represent different heart regions of interest. (AH: n = 9–10 in each group; p–value: two–way repeated ANOVA). VEB—ventricular escape beat.
Figure 4
Figure 4
Effects of IBR and ABR on calcium-handling and metabolic regulatory proteins. Representative gel blots and normalized expression of (A) Na+-Ca2+ exchanger (NCX) and total RyR2; n = 6–9 in each. (B) Sarcoplasmic reticulum Ca2+-ATPase 2a (SERCA2a); n = 9–10 in each. (C)Phospholamban (PLB), and phosphorylation of PLB at Threonine-17 and Serine-16. (D) Calcium/calmodulin-dependent kinase, type II (CaMKII); phosphorylation of CaMKII at Thr 286 or 287. C,D: n = 9 in each. (E) Ryanodine receptor type 2 (RyR2) and phosphorylation of RyR2 at Ser2814 and Ser2808; n = 6 in Ctrl and n = 8 in IBR and ABR groups. (F) 5′-adenosine monophosphate-activated protein kinase (AMPK), phosphorylation of AMPK at Thr 172; n = 9 in each, between IBR, ABR, and Ctrl groups. The p value for (AF): one-way ANOVA or Kruskal–Wallis test. GAPDH—glyceraldehyde 3-phosphate dehydrogenase.
Figure 4
Figure 4
Effects of IBR and ABR on calcium-handling and metabolic regulatory proteins. Representative gel blots and normalized expression of (A) Na+-Ca2+ exchanger (NCX) and total RyR2; n = 6–9 in each. (B) Sarcoplasmic reticulum Ca2+-ATPase 2a (SERCA2a); n = 9–10 in each. (C)Phospholamban (PLB), and phosphorylation of PLB at Threonine-17 and Serine-16. (D) Calcium/calmodulin-dependent kinase, type II (CaMKII); phosphorylation of CaMKII at Thr 286 or 287. C,D: n = 9 in each. (E) Ryanodine receptor type 2 (RyR2) and phosphorylation of RyR2 at Ser2814 and Ser2808; n = 6 in Ctrl and n = 8 in IBR and ABR groups. (F) 5′-adenosine monophosphate-activated protein kinase (AMPK), phosphorylation of AMPK at Thr 172; n = 9 in each, between IBR, ABR, and Ctrl groups. The p value for (AF): one-way ANOVA or Kruskal–Wallis test. GAPDH—glyceraldehyde 3-phosphate dehydrogenase.
Figure 5
Figure 5
Experimental protocol and setup. Schematic diagram of the rat study protocol, groupings, treatment, and electrophysiology measurements at different steps.

Similar articles

Cited by

References

    1. Hillmen P., Pitchford A., Bloor A., Broom A., Young M., Kennedy B., Walewska R., Furtado M., Preston G., Neilson J.R., et al. Ibrutinib and rituximab versus fludarabine, cyclophosphamide, and rituximab for patients with previously untreated chronic lymphocytic leukaemia (FLAIR): Interim analysis of a multicentre, open-label, randomised, phase 3 trial. Lancet Oncol. 2023;24:535–552. doi: 10.1016/S1470-2045(23)00144-4. - DOI - PubMed
    1. Dong R., Yan Y., Zeng X., Lin N., Tan B. Ibrutinib-Associated Cardiotoxicity: From the Pharmaceutical to the Clinical. Drug Des. Dev. Ther. 2022;16:3225–3239. doi: 10.2147/DDDT.S377697. - DOI - PMC - PubMed
    1. Quartermaine C., Ghazi S.M., Yasin A., Awan F.T., Fradley M., Wiczer T., Kalathoor S., Ferdousi M., Krishan S., Habib A., et al. Cardiovascular Toxicities of BTK Inhibitors in Chronic Lymphocytic Leukemia: JACC: CardioOncology State-of-the-Art Review. JACC Cardio Oncol. 2023;5:570–590. doi: 10.1016/j.jaccao.2023.09.002. - DOI - PMC - PubMed
    1. Mato A.R., Nabhan C., Thompson M.C., Lamanna N., Brander D.M., Hill B., Howlett C., Skarbnik A., Cheson B.D., Zent C., et al. Toxicities and outcomes of 616 ibrutinib-treated patients in the United States: A real-world analysis. Haematologica. 2018;103:874–879. doi: 10.3324/haematol.2017.182907. - DOI - PMC - PubMed
    1. Lampson B.L., Yu L., Glynn R.J., Barrientos J.C., Jacobsen E.D., Banerji V., Jones J.A., Walewska R., Savage K.J., Michaud G.F., et al. Ventricular arrhythmias and sudden death in patients taking ibrutinib. Blood. 2017;129:2581–2584. doi: 10.1182/blood-2016-10-742437. - DOI - PMC - PubMed

MeSH terms