. 2024 Jun 5;25(11):6221.
doi: 10.3390/ijms25116221.

Long-Term High-Fat Diet Limits the Protective Effect of Spontaneous Physical Activity on Mammary Carcinogenesis

Affiliations

Long-Term High-Fat Diet Limits the Protective Effect of Spontaneous Physical Activity on Mammary Carcinogenesis

Sébastien Marlin et al. Int J Mol Sci. .

Abstract

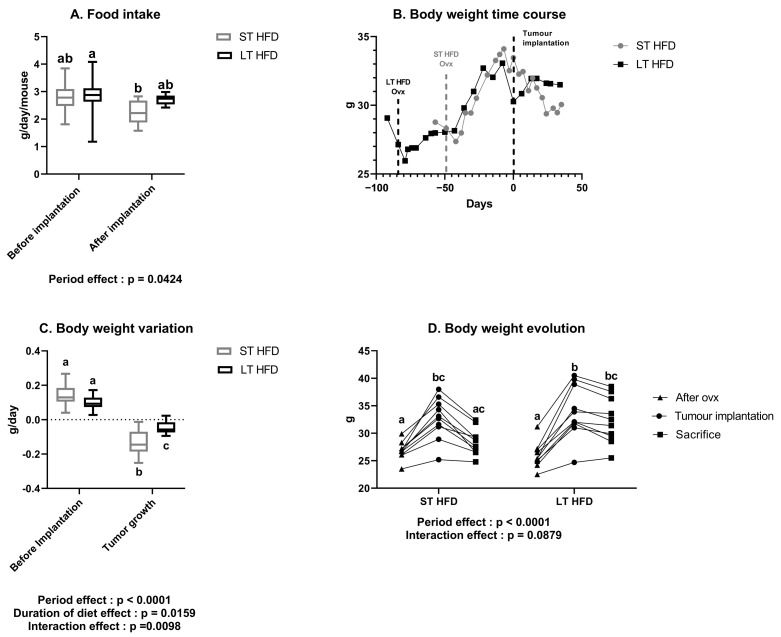
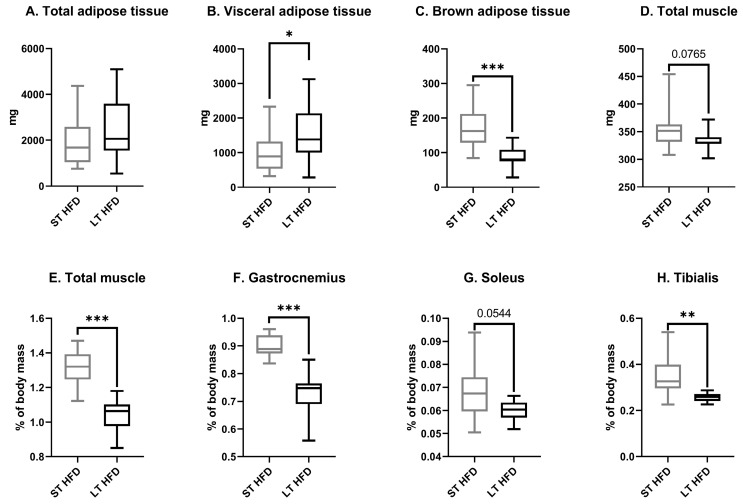
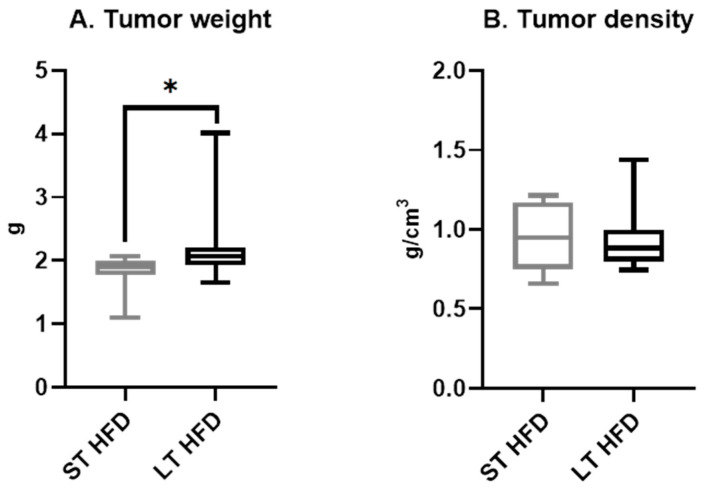
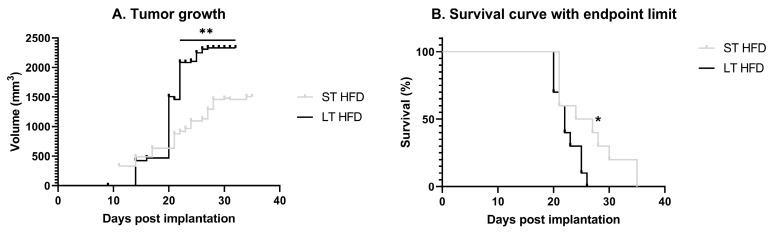
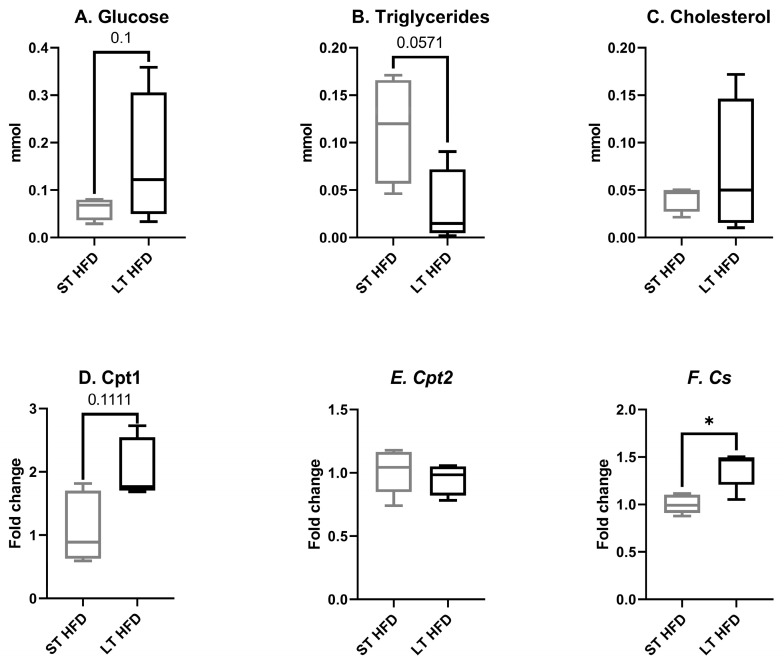
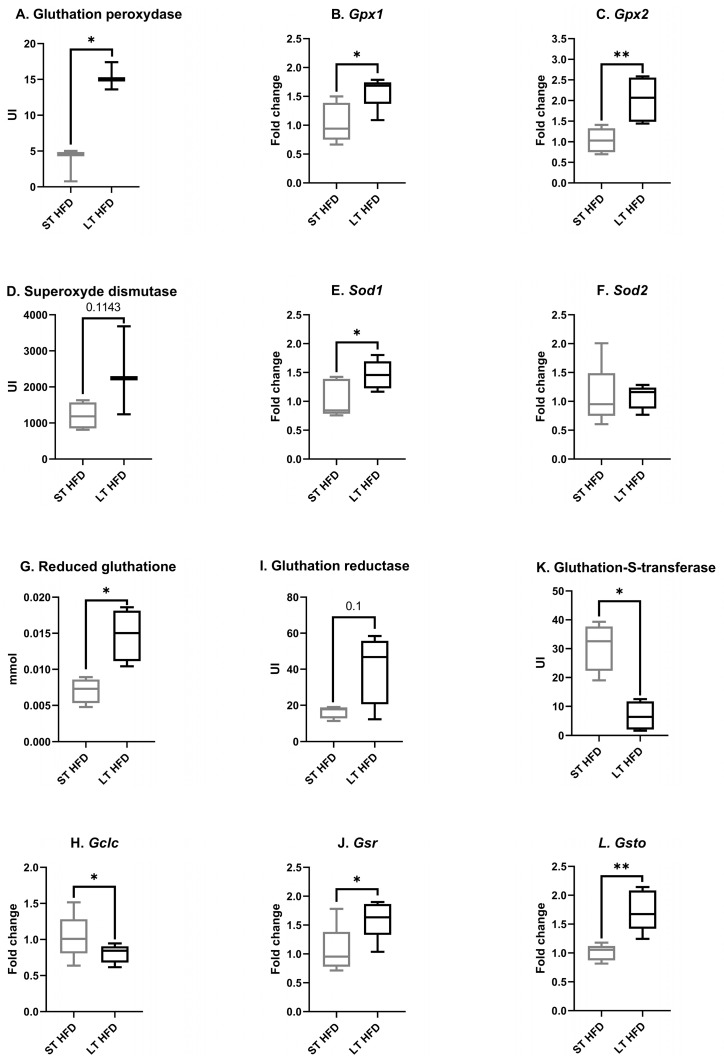
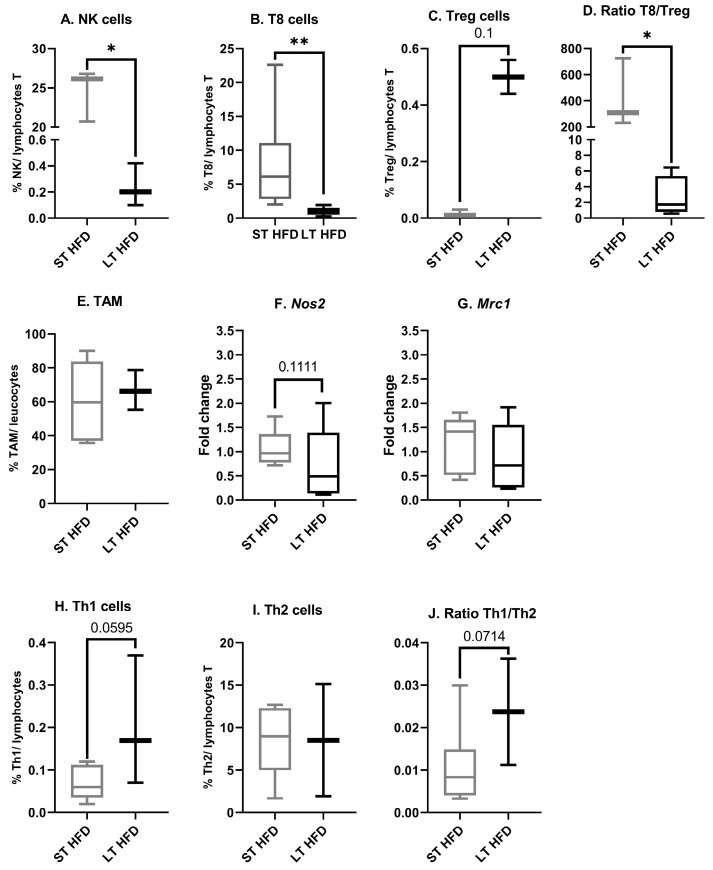
Breast cancer is influenced by factors such as diet, a sedentary lifestyle, obesity, and postmenopausal status, which are all linked to prolonged hormonal and inflammatory exposure. Physical activity offers protection against breast cancer by modulating hormones, immune responses, and oxidative defenses. This study aimed to assess how a prolonged high-fat diet (HFD) affects the effectiveness of physical activity in preventing and managing mammary tumorigenesis. Ovariectomised C57BL/6 mice were provided with an enriched environment to induce spontaneous physical activity while being fed HFD. After 44 days (short-term, ST HFD) or 88 days (long-term, LT HFD), syngenic EO771 cells were implanted into mammary glands, and tumour growth was monitored until sacrifice. Despite similar physical activity and food intake, the LT HFD group exhibited higher visceral adipose tissue mass and reduced skeletal muscle mass. In the tumour microenvironment, the LT HFD group showed decreased NK cells and TCD8+ cells, with a trend toward increased T regulatory cells, leading to a collapse of the T8/Treg ratio. Additionally, the LT HFD group displayed decreased tumour triglyceride content and altered enzyme activities indicative of oxidative stress. Prolonged exposure to HFD was associated with tumour growth despite elevated physical activity, promoting a tolerogenic tumour microenvironment. Future studies should explore inter-organ exchanges between tumour and tissues.

Keywords: high-fat diet; immunity; mammary carcinogenesis; obesity; oxidative stress; spontaneous physical activity; tumour microenvironment.


Conflict of interest statement

None of the authors have any conflicts of interest to report. The authors are responsible for the content and writing of the paper.

Figures

Figure 1
Figure 1
Impact of long-term high-fat diet on daily food intake and body weight evolution. (A) Food intake and (B) body weight time course throughout the experiment. (C) Body weight variation before and after tumour implantation. (D) Individual body weight evolution after ovariectomy (ovx) at tumour implantation and sacrifice. Data presented as boxes with median, interquartile range and min–max values (n = 10–11 mice/group) or individually were analysed by two-way ANOVA followed by a Tukey test with the factors being the experimentation period and the diet duration. Values with different superscript letters are statistically different, p < 0.05. ST and LT HFD: short- or long-term high-fat diet.
Figure 2
Figure 2
Adipose and muscle masses at sacrifice. Absolute (AD) or relative mass (EH). Data presented as boxes with median, interquartile range and min–max values (n = 10–13 mice/group) were analysed by a Mann–Whitney test, * p < 0.05, ** p < 0.01, *** p < 0.001. ST and LT HFD: short- or long-term high-fat diet.
Figure 3
Figure 3
Tumour characteristics. Tumor weight (A) and density (B) (n = 10/13 /group) are presented as boxes with median, interquartile range and min–max values and were analysed by a Mann–Whitney test, * p < 0.05. ST and LT HFD: short- or long-term high-fat diet.
Figure 4
Figure 4
Tumour progression and animal survival. (A) Tumour growth evolution depending on the diet duration, results are in volume (mm3) with an individual calliper measure. (B). Time course of survival with end-point limit. The end-point limit was a 2 cm3 tumour, as required by ethical guidelines. Mean ± SEM (n = 10–13/group). Data were analysed by repeated measures ANOVA or by Mantel–Cox text as appropriate, * p < 0.05, ** p < 0.01. ST and LT HFD: short- or long-term high-fat diet.
Figure 5
Figure 5
Tumour biological markers and expression of enzymes involved in energy metabolism. (AC) Glucose, triglyceride, and cholesterol concentrations were measured using specific kits from Biolabo. (DF) Cpt1, Cpt2, and Cs mRNA expression were measured by RT-qPCR and normalised with Hprt. Biochemistry assays were performed on 4 mice/group and mRNA expression analysis on 5 mice/group. Results are expressed in min–max ± SEM. Data were analysed by a Mann–Whitney test, * p < 0.05. ST and LT HFD: short- or long-term high-fat diet.
Figure 6
Figure 6
Antioxidant defence in the tumour microenvironment. (A,I,K) Enzyme activities were evaluated using a spectrophotometric assay measuring the disappearance or apparition of the co-substrate NADPH, H+. (D) Superoxide dismutase (SOD) activity was measured using a kit from Sigma-Aldrich. (G) Reduced glutathione (GSH) was quantified using a spectrophotometric assay measuring the appearance of the 2-nitro-5-thiobenzoate (TNB) after the reaction between GSH and 5,5′-dithiobis-TNB. (B,C,E,F,H,J,L) mRNA expression was determined by RT-qPCR and normalised with Hprt. Enzyme activity assays were performed on 4 mice/group and targeted transcriptomic analysis on 5 mice/group. Results are presented as boxes with median, interquartile range and min–max values. Data were analysed by a Mann–Whitney test, * p < 0.05, ** p < 0.01. ST and LT HFD: short- or long-term high-fat diet.
Figure 7
Figure 7
Tumour microenvironnement immune infiltration. (AE,HJ) Sub-populations of immune cells were quantified by flow cytometry using marked antibodies against specific cell surface markers. (F,G) mRNA expression of Nos2, a specific marker of M1, and Mrc1, a specific marker of M2, were explored using RT-qPCR and normalised with Cd45. Flow cytometry was performed on 10–13 mice/group and mRNA expression analysis on 5 mice/group. Results are presented as boxes with median, interquartile range and min–max values. Data were analysed by a Mann–Whitney test, * p < 0.05, ** p < 0.01. ST and LT HFD: short- or long-term high-fat diet.

Similar articles

Cited by

References

    1. Ferlay J., Ervik M., Laversanne M., Colombet M., Mery L., Piñeros M., Znaor A., Soerjomataram I., Bray F. Global Cancer Observatory: Cancer Today. Lyon, France: International Agency for Research on Cancer. [(accessed on 21 February 2024)]. Available online: https://gco.iarc.who.int/today.
    1. Tung N., Lin N.U., Kidd J., Allen B.A., Singh N., Wenstrup R.J., Hartman A.-R., Winer E.P., Garber J.E. Frequency of Germline Mutations in 25 Cancer Susceptibility Genes in a Sequential Series of Patients With Breast Cancer. J. Clin. Oncol. 2024;34:1460. doi: 10.1200/JCO.2015.65.0747. - DOI - PMC - PubMed
    1. Michailidou K., Lindström S., Dennis J., Beesley J., Hui S., Kar S., Lemaçon A., Soucy P., Glubb D., Rostamianfar A., et al. Association Analysis Identifies 65 New Breast Cancer Risk Loci. Nature. 2017;551:92–94. doi: 10.1038/nature24284. - DOI - PMC - PubMed
    1. Möller S., Mucci L.A., Harris J.R., Scheike T., Holst K., Halekoh U., Adami H.-O., Czene K., Christensen K., Holm N.V., et al. The Heritability of Breast Cancer among Women in the Nordic Twin Study of Cancer. Cancer Epidemiol. Biomark. Prev. 2016;25:145–150. doi: 10.1158/1055-9965.EPI-15-0913. - DOI - PubMed
    1. Shiovitz S., Korde L.A. Genetics of Breast Cancer: A Topic in Evolution. Ann. Oncol. 2015;26:1291–1299. doi: 10.1093/annonc/mdv022. - DOI - PMC - PubMed

MeSH terms

LinkOut - more resources