

From the Microbiome to the Electrome: Implications for the Microbiota-Gut-Brain Axis
- PMID: 38892419
- PMCID: PMC11172653
- DOI: 10.3390/ijms25116233
From the Microbiome to the Electrome: Implications for the Microbiota-Gut-Brain Axis
Abstract
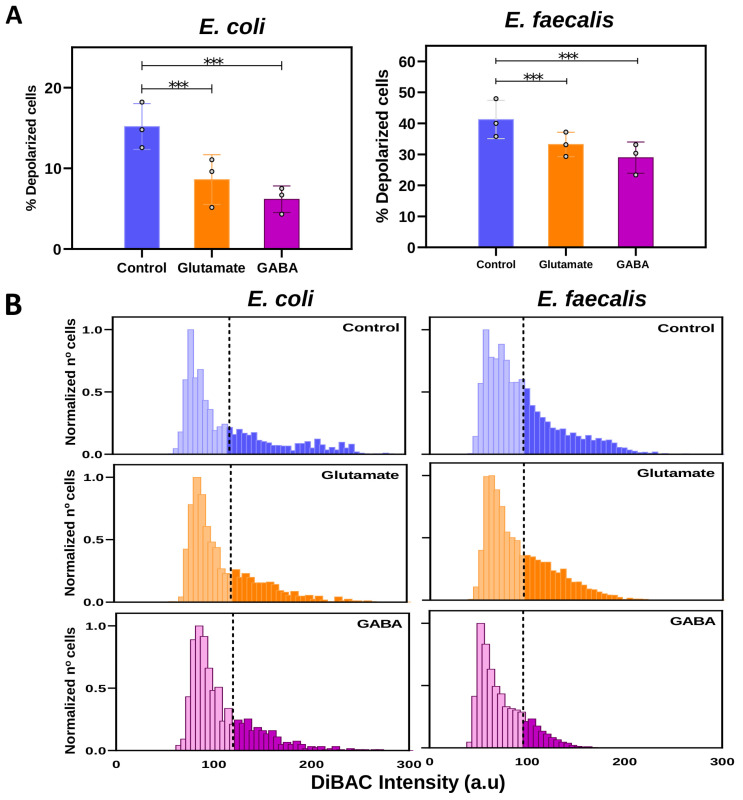
The gut microbiome plays a fundamental role in metabolism, as well as the immune and nervous systems. Microbial imbalance (dysbiosis) can contribute to subsequent physical and mental pathologies. As such, interest has been growing in the microbiota-gut-brain brain axis and the bioelectrical communication that could exist between bacterial and nervous cells. The aim of this study was to investigate the bioelectrical profile (electrome) of two bacterial species characteristic of the gut microbiome: a Proteobacteria Gram-negative bacillus Escherichia coli (E. coli), and a Firmicutes Gram-positive coccus Enterococcus faecalis (E. faecalis). We analyzed both bacterial strains to (i) validate the fluorescent probe bis-(1,3-dibutylbarbituric acid) trimethine oxonol, DiBAC4(3), as a reliable reporter of the changes in membrane potential (Vmem) for both bacteria; (ii) assess the evolution of the bioelectric profile throughout the growth of both strains; (iii) investigate the effects of two neural-type stimuli on Vmem changes: the excitatory neurotransmitter glutamate (Glu) and the inhibitory neurotransmitter γ-aminobutyric acid (GABA); (iv) examine the impact of the bioelectrical changes induced by neurotransmitters on bacterial growth, viability, and cultivability using absorbance, live/dead fluorescent probes, and viable counts, respectively. Our findings reveal distinct bioelectrical profiles characteristic of each bacterial species and growth phase. Importantly, neural-type stimuli induce Vmem changes without affecting bacterial growth, viability, or cultivability, suggesting a specific bioelectrical response in bacterial cells to neurotransmitter cues. These results contribute to understanding the bacterial response to external stimuli, with potential implications for modulating bacterial bioelectricity as a novel therapeutic target.
Keywords: Gram-negative; Gram-positive; bis-(1,3-dibutylbarbituric acid) trimethine oxonol-DiBAC; growth phase; membrane potential; microbiota–gut–brain axis; neurotransmitters.
Conflict of interest statement
The authors declare no conflicts of interest.
Figures


Similar articles
-
From bugs to brain: unravelling the GABA signalling networks in the brain-gut-microbiome axis.Brain. 2025 May 13;148(5):1479-1506. doi: 10.1093/brain/awae413. Brain. 2025. PMID: 39716883 Free PMC article. Review.
-
Impact of Iron Deficiency on the Growth and Bioelectrical Profile of Different Gut Bacteria.Microbiologyopen. 2025 Jun;14(3):e70015. doi: 10.1002/mbo3.70015. Microbiologyopen. 2025. PMID: 40452591 Free PMC article.
-
Bioelectrical State of Bacteria Is Linked to Growth Dynamics and Response to Neurotransmitters: Perspectives for the Investigation of the Microbiota-Brain Axis.Int J Mol Sci. 2023 Aug 29;24(17):13394. doi: 10.3390/ijms241713394. Int J Mol Sci. 2023. PMID: 37686197 Free PMC article.
-
Gut microbiota alterations reveal potential gut-brain axis changes in polycystic ovary syndrome.J Endocrinol Invest. 2021 Aug;44(8):1727-1737. doi: 10.1007/s40618-020-01481-5. Epub 2021 Jan 2. J Endocrinol Invest. 2021. PMID: 33387350
-
Gut microbiota modulates neurotransmitter and gut-brain signaling.Microbiol Res. 2024 Oct;287:127858. doi: 10.1016/j.micres.2024.127858. Epub 2024 Jul 26. Microbiol Res. 2024. PMID: 39106786 Review.
Cited by
-
From bugs to brain: unravelling the GABA signalling networks in the brain-gut-microbiome axis.Brain. 2025 May 13;148(5):1479-1506. doi: 10.1093/brain/awae413. Brain. 2025. PMID: 39716883 Free PMC article. Review.
-
Impact of Iron Deficiency on the Growth and Bioelectrical Profile of Different Gut Bacteria.Microbiologyopen. 2025 Jun;14(3):e70015. doi: 10.1002/mbo3.70015. Microbiologyopen. 2025. PMID: 40452591 Free PMC article.
-
An in vitro neurobacterial interface reveals direct modulation of neuronal function by gut bacteria.Sci Rep. 2025 Jul 15;15(1):25535. doi: 10.1038/s41598-025-10382-7. Sci Rep. 2025. PMID: 40664808 Free PMC article.
-
Molecular mechanisms and therapeutic strategies of gut microbiota modulation in Sarcopenia (Review).Oncol Lett. 2024 Dec 17;29(3):104. doi: 10.3892/ol.2024.14850. eCollection 2025 Mar. Oncol Lett. 2024. PMID: 39736924 Free PMC article. Review.
References
MeSH terms
Substances
Grants and funding
LinkOut - more resources
Full Text Sources
Molecular Biology Databases
Research Materials
Miscellaneous
