. 2024 Jun 6;25(11):6249.
doi: 10.3390/ijms25116249.

Triple Blockade of Oncogenic RAS Signaling Using KRAS and MEK Inhibitors in Combination with Irradiation in Pancreatic Cancer

Affiliations

Triple Blockade of Oncogenic RAS Signaling Using KRAS and MEK Inhibitors in Combination with Irradiation in Pancreatic Cancer

Xuan Wang et al. Int J Mol Sci. .

Abstract

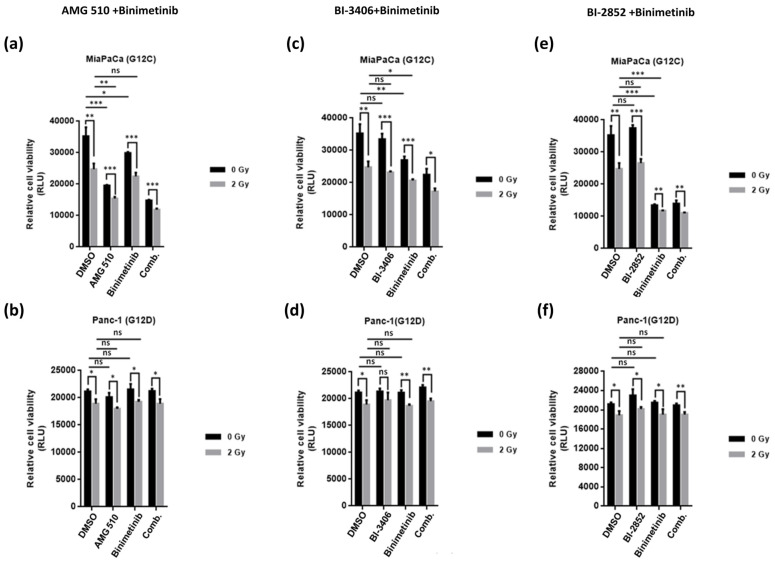
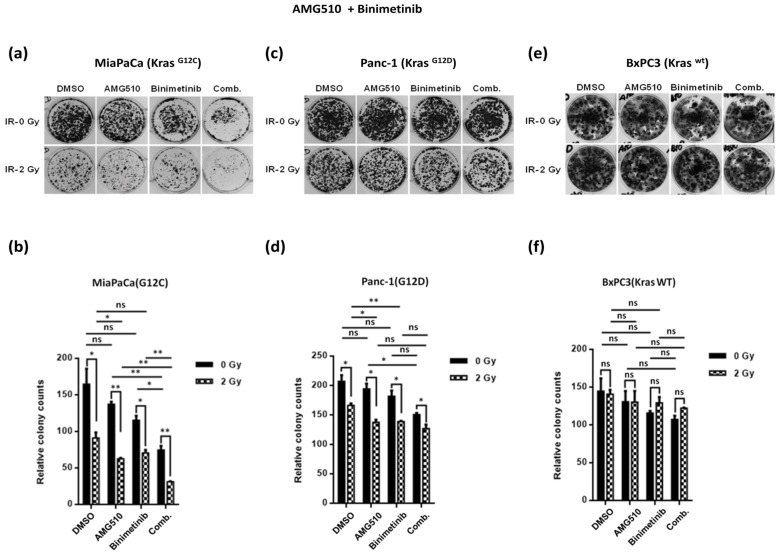
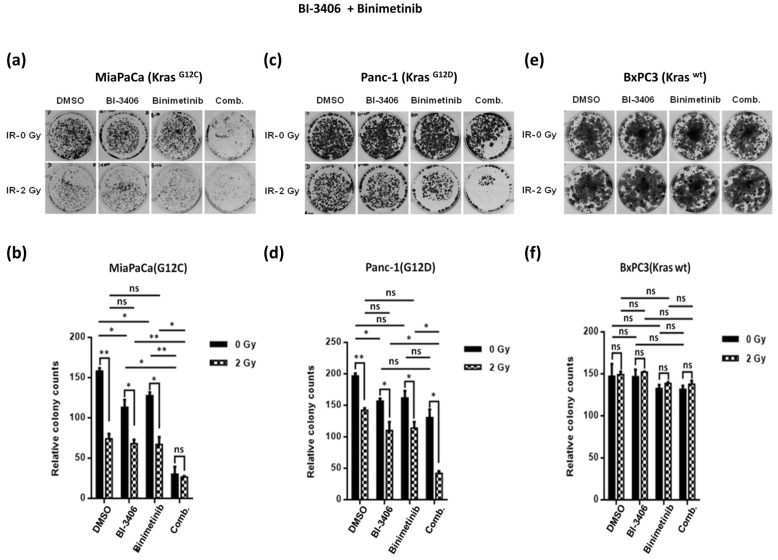
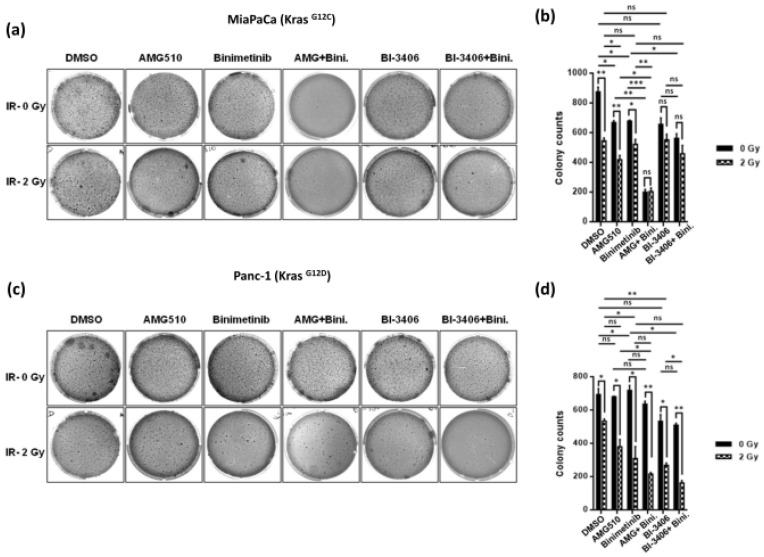
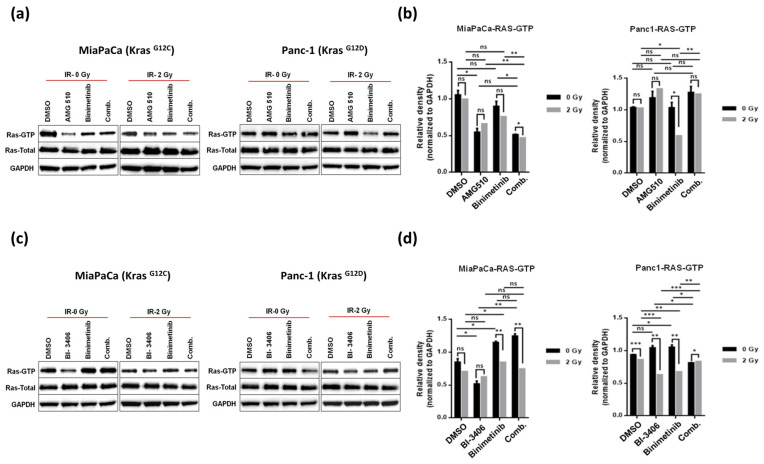
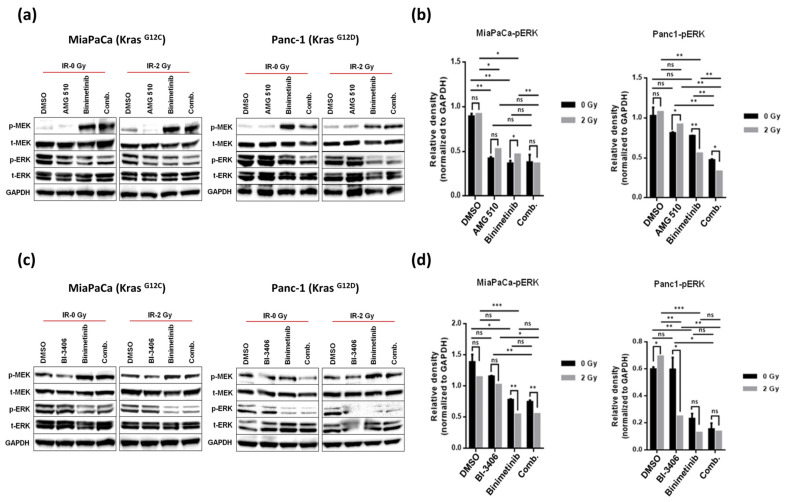
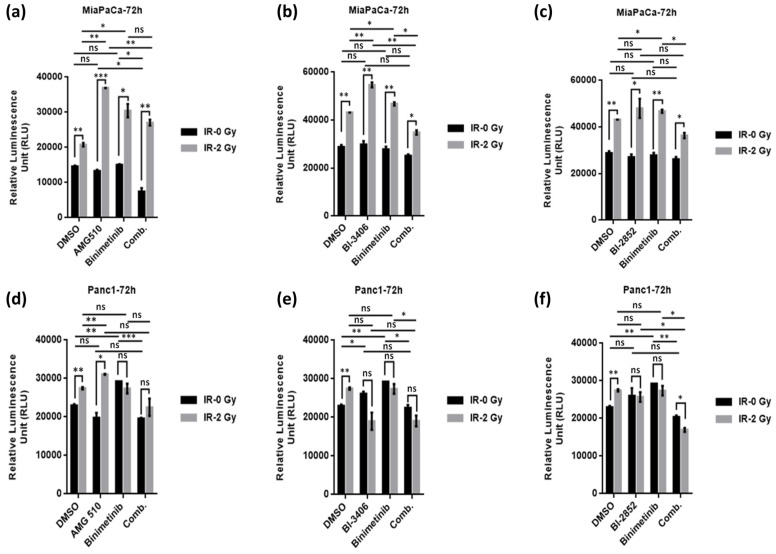
Pancreatic ductal adenocarcinoma (PDAC) is one of the deadliest of human malignancies and carries an exceptionally poor prognosis. It is mostly driven by multiple oncogenic alterations, with the highest mutation frequency being observed in the KRAS gene, which is a key oncogenic driver of tumorogenesis and malignant progression in PDAC. However, KRAS remained undruggable for decades until the emergence of G12C mutation specific KRAS inhibitors. Despite this development, this therapeutic approach to target KRAS directly is not routinely used for PDAC patients, with the reasons being the rare presence of G12C mutation in PDAC with only 1-2% of occurring cases, modest therapeutic efficacy, activation of compensatory pathways leading to cell resistance, and absence of effective KRASG12D or pan-KRAS inhibitors. Additionally, indirect approaches to targeting KRAS through upstream and downstream regulators or effectors were also found to be either ineffective or known to cause major toxicities. For this reason, new and more effective treatment strategies that combine different therapeutic modalities aiming at achieving synergism and minimizing intrinsic or adaptive resistance mechanisms are required. In the current work presented here, pancreatic cancer cell lines with oncogenic KRAS G12C, G12D, or wild-type KRAS were treated with specific KRAS or SOS1/2 inhibitors, and therapeutic synergisms with concomitant MEK inhibition and irradiation were systematically evaluated by means of cell viability, 2D-clonogenic, 3D-anchorage independent soft agar, and bioluminescent ATP assays. Underlying pathophysiological mechanisms were examined by using Western blot analyses, apoptosis assay, and RAS activation assay.

Keywords: KRAS inhibitors; MEK inhibitor; RAS/MAPK pathway; combination therapy; irradiation; pancreatic cancer.


Conflict of interest statement

The authors declare no conflict of interest.

Figures

Figure 1
Figure 1
Relative cell viability of MiaPacaKrasG12C and Panc-1KrasG12D cells treated with AMG-510 (a,b), BI-3406 (c,d), and BI-2852 (e,f) at a concentration of 10 nM, 100 nM, and 1 µM, respectively, either singly or in combination with Binimetinib used at a concentration of 10 nM exposed to either low-dose irradiation (2 Gy) or no irradiation (0 Gy). The mitochondrial metabolic function (viability) is plotted as relative luminescence unit (RLU) of treated cells in relation to mock treated cells. Results of three independent experiments are shown and are expressed as means ± SD. Statistical significance has been indicated as * p < 0.05, ** p < 0.01, *** p < 0.001, ns = non-significant.
Figure 2
Figure 2
Representative images of colony formation assay for MiaPaCaKrasG12C, Panc-1KrasG12D, and BxPC3KrasWT cells treated with AMG-510 at a concentration of 10 nM and Binimetinib at a concentration of 10 nM either singly or in combination with each other in the presence of low-dose irradiation (2 Gy) or no irradiation (0 Gy) (a,c,e). Colonies formed were counted and plotted, where the drug-treated cells were normalized to DMSO-treated cells in their respective irradiation group (b,d,f). The results from three independent experiments are shown and expressed as means ± SD, and the level of significance has been indicated accordingly (* p < 0.05, ** p < 0.01, ns = non-significant).
Figure 3
Figure 3
Representative images of colony formation assay for MiaPaCaKrasG12C, Panc-1KrasG12D, and BxPC3KrasWT cells treated with BI-3406 at a concentration of 100 nM and Binimetinib at a concentration of 10 nM either singly or in combination with each other in the presence of low-dose irradiation (2 Gy) or no irradiation (0 Gy) (a,c,e). Colonies formed were counted and plotted, where the drug-treated cells were normalized to mock treated cells in their respective irradiation group (b,d,f). The results from three independent experiments are shown and expressed as means ± SD, and the level of significance has been indicated accordingly (* p < 0.05, ** p < 0.01, ns = non-significant).
Figure 4
Figure 4
Representative images of colony formation assay for MiaPaCaKrasG12C, Panc-1KrasG12D, and BxPC3KrasWT cells treated with BI-2852 at a concentration of 5 µM and Binimetinib at a concentration of 10 nM either singly or in combination with each other in the presence of low dose irradiation (2 Gy) or no irradiation (0 Gy) (a,c,e). Colonies formed were counted and plotted, where the drug treated cells were normalized to mock treated cells in their respective irradiation group (b,d,f). The results from three independent experiments are shown and expressed as means ± SD and the level of significance has been indicated accordingly (* p < 0.05, ** p < 0.01, ns = non-significant).
Figure 5
Figure 5
Representative images illustrating anchorage independent growth of cell colonies in three dimensional (3D) matrix for MiaPaCaKrasG12C and Panc-1KrasG12D cells treated with either AMG-510 at a concentration of 10 nM or BI-3406 at a concentration of 100 nM in combination to Binimetinib used at a concentration of 10 nM in the presence of low-dose irradiation (IR-2 Gy) or no irradiation (IR- 0 Gy) (a,c). Colonies formed were counted and plotted, where the drug-treated cells were normalized to mock treated cells in their respective irradiation group (b,d). Data represented as means ± SD for three independent experiments, and statistical significance was stated accordingly (* p < 0.05, ** p < 0.01, *** p < 0.001, ns = non-significant).
Figure 6
Figure 6
Pull-down assay of activated RAS performed on MiaPaCaKrasG12C and Panc-1KrasG12D treated with AMG-510 at a concentration of 10 nM and BI-3406 at a concentration of 100 nM either singly or in combination to Binimetinib used at a concentration of 10 nM in the presence (IR-2Gy) and absence of irradiation (IR-0Gy). The GTP bound form of RAS was pulled down with His-tagged fusion protein corresponding to RAS binding domain of Raf-1 conjugated to agarose beads. The RAS-GTP bound to the beads, and the total RAS levels were identified using anti-RAS antibodies. GAPDH was used as a loading control (a,c). Comparative densitometric analysis of normalized RAS-GTP between the non-irradiated and irradiated groups has been shown as means ± SD for both cell lines in the bar diagrams on the right (b,d), and statistical significance was stated accordingly (* p < 0.05, ** p < 0.01, *** p < 0.001, ns = non-significant).
Figure 7
Figure 7
Immunoblots of pMEK and pERK1/2 in both KRAS mutant cell lines, namely MiaPaCaKrasG12C and Panc-1KrasG12D (a,c). Both the cell lines were treated with AMG-510 at a concentration of 10 nM and BI-3406 at a concentration of 100 nM singly or in combination with Binimetinib used at a concentration of 10 nM under low-dose irradiation (IR-2 Gy) or no irradiation (IR- 0Gy). GAPDH was used as a loading control. Comparative densitometric analysis for normalized pERK1/2 between the non-irradiated and irradiated groups has been shown as means ± SD for both cell lines in the bar diagrams on the right (b,d), and statistical significance was stated accordingly (* p < 0.05, ** p < 0.01, *** p < 0.001, ns = non-significant).
Figure 8
Figure 8
Apoptosis induction by measuring the Annexin V binding (luminescence) from KRAS mutated cell lines, MiaPaCaKrasG12C, and Panc-1KrasG12D, respectively, after exposing them to AMG-510 at a concentration of 10 nM (a,d), BI-3406 at a concentration of 100 nM (b,e), and BI-2852 at a concentration of 5 µM (c,f) singly or in combination with Binimetinib at a concentration of 10 nM in the absence (IR-0Gy) and presence of irradiation (IR-2Gy). The results are shown as means ± SD, and the level of significance has been indicated accordingly (* p < 0.05, ** p < 0.01, *** p < 0.001, ns = non-significant).

Similar articles

Cited by

References

    1. Sung H., Ferlay J., Siegel R.L., Laversanne M., Soerjomataram I., Jemal A., Bray F., Bsc M.F.B., Me J.F., Soerjomataram M.I., et al. Global Cancer Statistics 2020: GLOBOCAN Estimates of Incidence and Mortality Worldwide for 36 Cancers in 185 Countries. CA Cancer J. Clin. 2021;71:209–249. doi: 10.3322/caac.21660. - DOI - PubMed
    1. Rahib L., Smith B.D., Aizenberg R., Rosenzweig A.B., Fleshman J.M., Matrisian L.M. Projecting cancer incidence and deaths to 2030: The unexpected burden of thyroid, liver, and pancreas cancers in the United States. Cancer Res. 2014;74:2913–2921. doi: 10.1158/0008-5472.CAN-14-0155. - DOI - PubMed
    1. Rahib L., Wehner M.R., Matrisian L.M., Nead K.T. Estimated Projection of US Cancer Incidence and Death to 2040. JAMA Netw. Open. 2021;4:e214708. doi: 10.1001/jamanetworkopen.2021.4708. - DOI - PMC - PubMed
    1. Siegel R.L., Miller K.D., Jemal A. Cancer Statistics, 2018. CA Cancer J. Clin. 2018;68:7–30. doi: 10.3322/caac.21442. - DOI - PubMed
    1. Kleeff J., Korc M., Apte M., La Vecchia C., Johnson C.D., Biankin A.V., Neale R.E., Tempero M., Tuveson D.A., Hruban R.H., et al. Pancreatic cancer. Nat. Rev. Dis. Primers. 2016;2:16022. doi: 10.1038/nrdp.2016.22. - DOI - PubMed

MeSH terms

Substances