Review
. 2024 Jun 6;25(11):6248.
doi: 10.3390/ijms25116248.

NOTCH3 and Pulmonary Arterial Hypertension

Affiliations
Review

NOTCH3 and Pulmonary Arterial Hypertension

Nolan M Winicki et al. Int J Mol Sci. .

Abstract

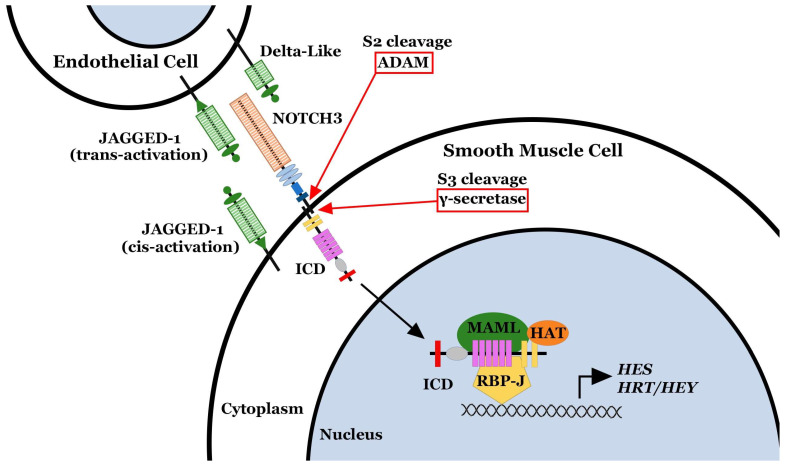
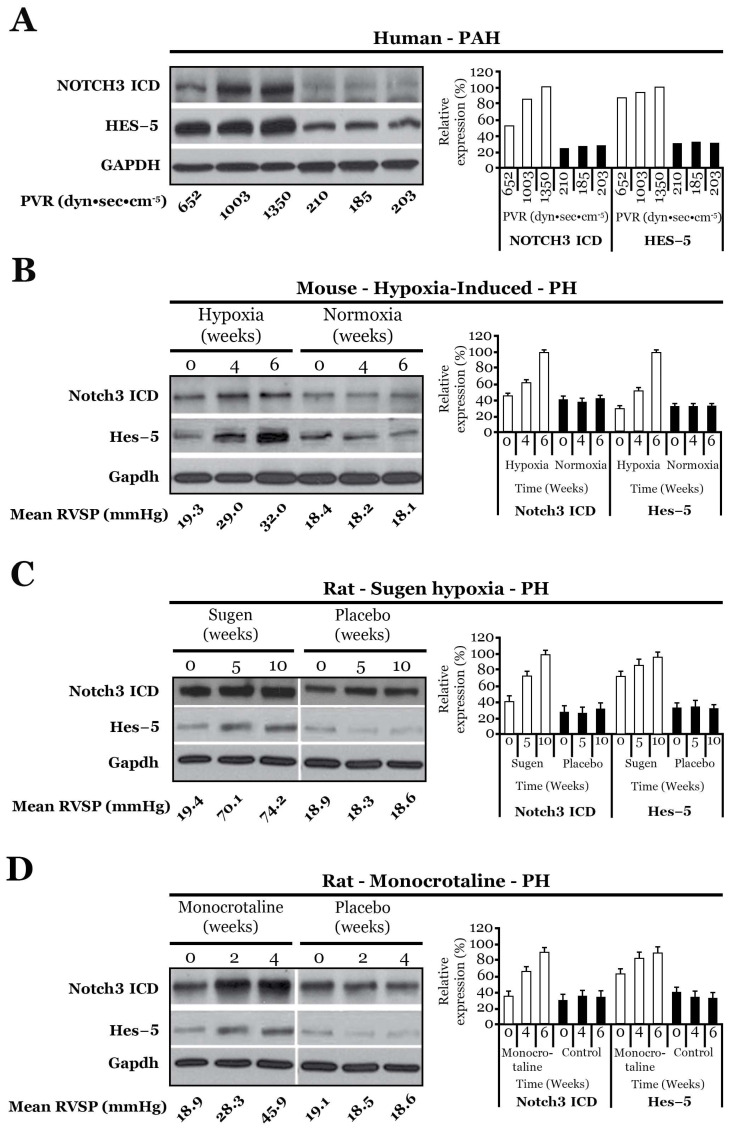
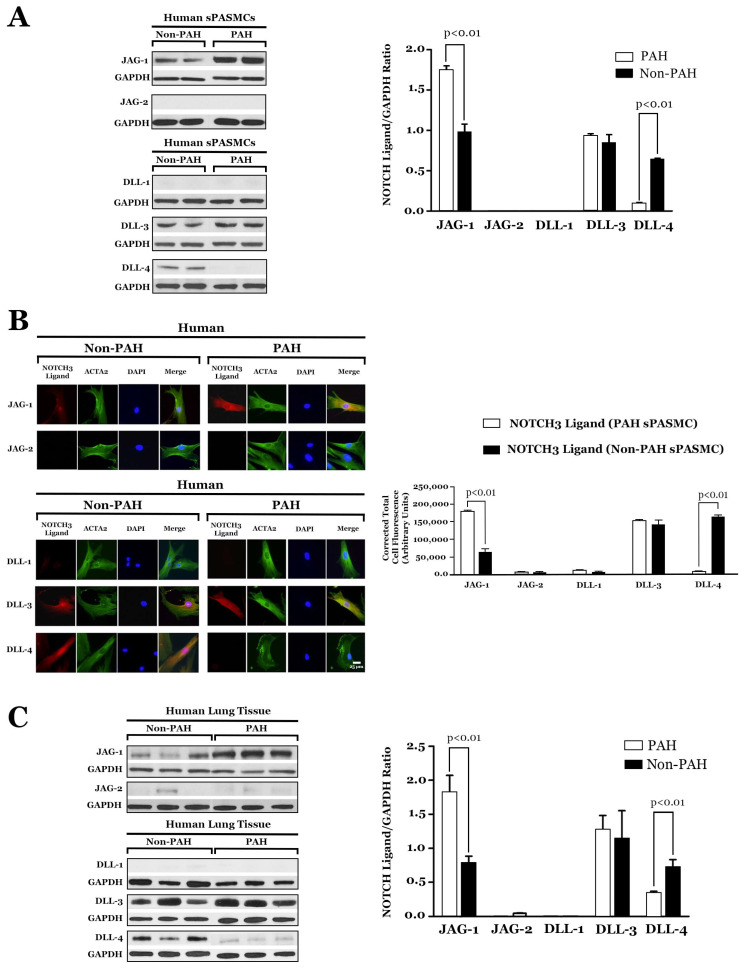
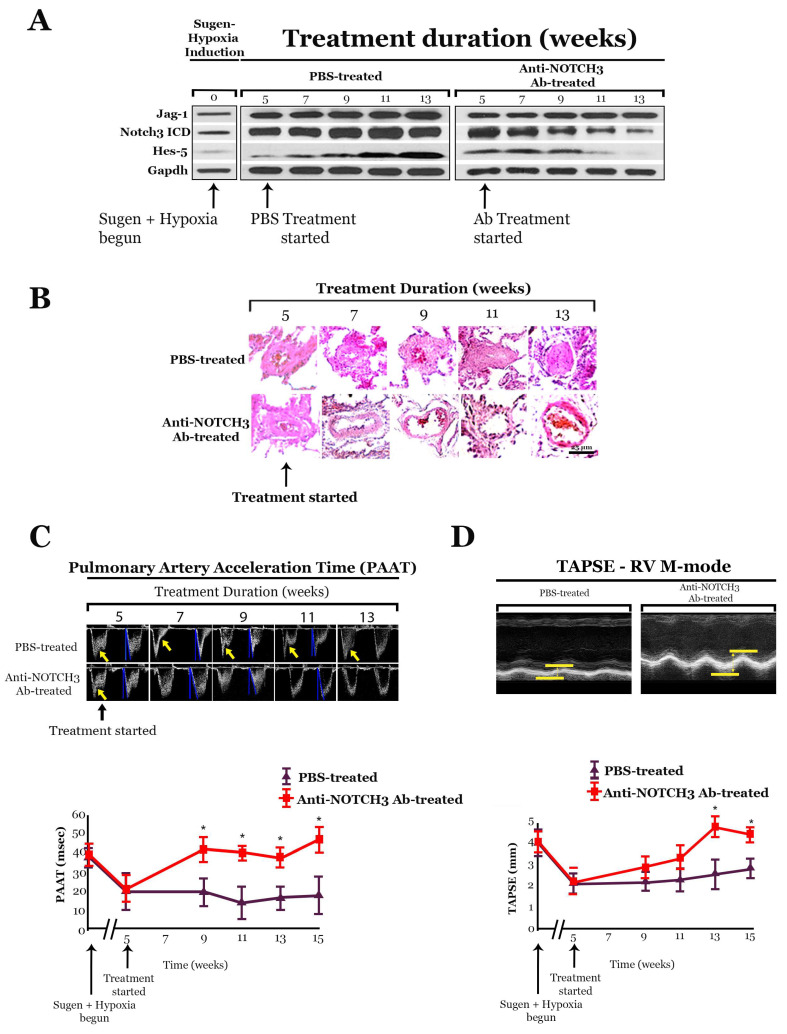
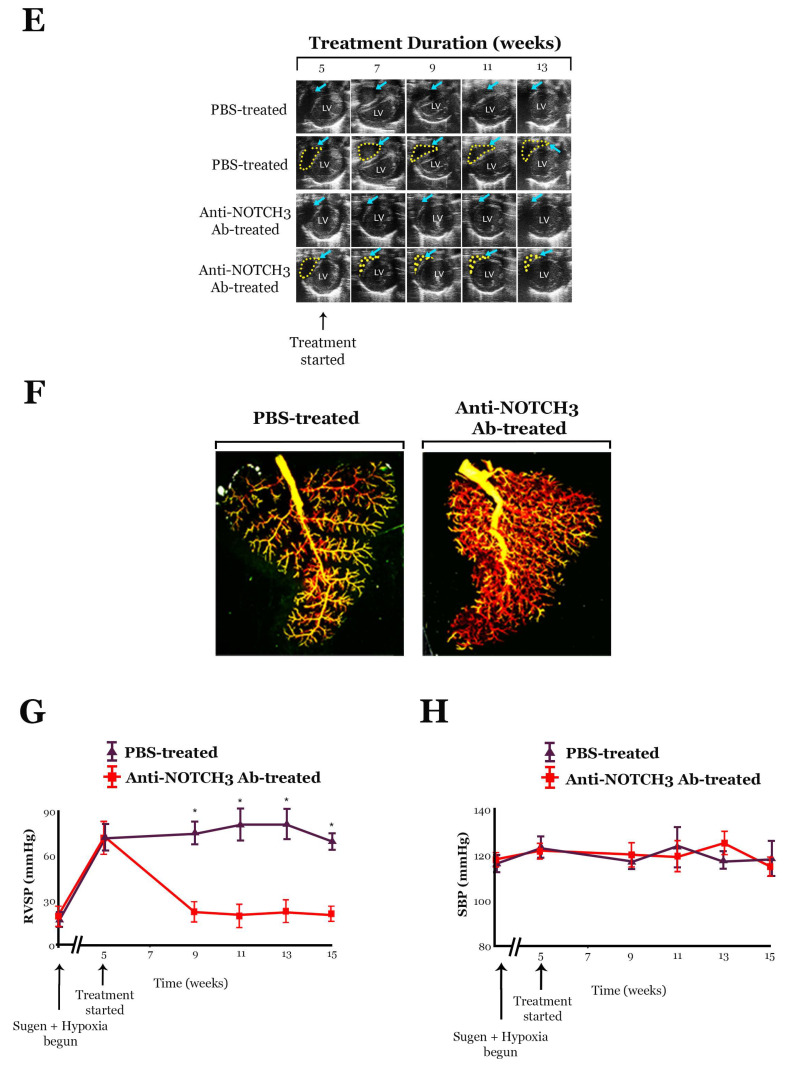
NOTCH3 receptor signaling has been linked to the regulation of smooth muscle cell proliferation and the maintenance of smooth muscle cells in an undifferentiated state. Pulmonary arterial hypertension (World Health Organization Group 1 idiopathic disease: PAH) is a fatal disease characterized clinically by elevated pulmonary vascular resistance caused by extensive vascular smooth muscle cell proliferation, perivascular inflammation, and asymmetric neointimal hyperplasia in precapillary pulmonary arteries. In this review, a detailed overview of the specific role of NOTCH3 signaling in PAH, including its mechanisms of activation by a select ligand, downstream signaling effectors, and physiologic effects within the pulmonary vascular tree, is provided. Animal models showing the importance of the NOTCH3 pathway in clinical PAH will be discussed. New drugs and biologics that inhibit NOTCH3 signaling and reverse this deadly disease are highlighted.

Keywords: DLL-4; HES-5; JAG-1; NOTCH3; Notch3; PAH; pulmonary arterial hypertension.


Conflict of interest statement

The authors declare no conflicts of interest.

Figures

Figure 1
Figure 1
NOTCH3 is activated by the binding of the JAGGED-1 ligand, stimulating the proteolytic S2 cleavage by ADAM of the NOTCH3 extracellular domain (ECD) and intracellular domain (ICD). Then, S3 cleavage by γ-secretase liberates the ICD into the cytoplasm. The ICD translocates to the nucleus and binds to the RBP-J transcription complex and functions as a transcriptional enhancer of Hairy/Enhancer of Split (HES) and Hairy/Enhancer of Split-related (HRT/HEY) genes.
Figure 2
Figure 2
(A) Left: Western blot analysis of NOTCH3 ICD and HES-5 relative to GAPDH in the lungs of subjects with varying severities of PAH and control individuals. ICD, intracellular domain. PVR, pulmonary vascular resistance. Right: Relative expression values obtained by densitometry of NOTCH3 ICD or HES-5 protein normalized to GAPDH (n = 1 for each PVR listed). (B) Left: Western blot analysis of Notch3 ICD and Hes-5 relative to Gapdh from mouse lungs during the development of hypoxia-induced pulmonary hypertension, compared to normoxic animals. Right: Relative expression values obtained by densitometry of Notch3 ICD or Hes-5 proteins normalized to Gapdh (n = 20 animals for each time point). RVSP, right ventricular systolic pressure (mmHg). (C) Left: Western blot analysis of Notch3 ICD and Hes-5 relative to Gapdh from rat lungs during the development of Sugen-induced pulmonary hypertension, compared to control animals (For (BD), four measurements of RSVP were taken over a 10-min period and averaged). Right: Relative expression values obtained by densitometry of Notch3 ICD or Hes-5 protein normalized to Gapdh (n = 20 animals for each time point). (D) Left: Western blot analysis of Notch3 ICD and Hes-5 relative to Gapdh from rat lungs during the development of monocrotaline-induced pulmonary hypertension, compared to control animals. Right: Relative expression values obtained by densitometry of Notch3 ICD or Hes-5 protein normalized to Gapdh (n = 20 animals for each time point). Figure modified and adapted from previous publication [8].
Figure 3
Figure 3
(A) Left: Western blot analysis of NOTCH ligands relative to GAPDH in subcultured sPASMCs from PAH and non-PAH individuals. Right: Relative expression values obtained by densitometry of NOTCH3 ligand proteins normalized to GAPDH (n = 10 sPASMC subcultures per group). (B) Left: NOTCH3 ligand (red) and α-smooth muscle actin (ACTA2; green) immunofluorescence staining of human PAH and non-PAH-subcultured sPASMCs. Nuclei were counterstained with 4′,6-diamidino-2-phenylindole (DAPI) (blue). Scale bar, 25 μm. Right: Relative fluorescence values obtained by densitometry of NOTCH3 ligands normalized to background readings (n = 10 representative cells for each NOTCH3 ligand). (C) Left: Western blot analysis of NOTCH ligands relative to GAPDH in lung tissue from three different individuals. Right: Relative expression values obtained by densitometry of NOTCH3 ligand proteins normalized to GAPDH (n = 20 lung samples from 20 patients in each group). Figure modified and adapted from previous publication [8].
Figure 4
Figure 4
Rats were intraperitoneally injected with Sugen (20 mg/kg) followed by 3 weeks of hypoxia and 2 weeks of normoxia to induce pulmonary hypertension (PH). Subsequently, animals were treated with subcutaneous anti-NOTCH3 Ab 28042 (40 mg/kg) or placebo (PBS) under normoxic conditions for 10 weeks. (A) Western blot analysis of Jag-1, Notch3 ICD, and Hes-5 in the lungs of Sugen-hypoxia rats treated with anti-NOTCH3 Ab 28042 or PBS, normalized to Gapdh. (B) H&E-stained sections of small pulmonary arteries from lungs of rats at the beginning of treatment and during treatment with anti-NOTCH3 Ab 28042 or PBS. Results are representative sections from five rats per group at each time point. Scale bar, 25 μm. (C) Top: Representative continuous-wave Doppler signals measured from the right ventricular outflow tract before and during rat treatment with anti-NOTCH3 Ab 28042 compared to controls. Main pulmonary artery blood flow in PBS-treated rats showed shortened acceleration to peak velocity and midsystolic notching (yellow arrows), indicative of elevated pulmonary vascular resistance. Bottom: Graph of pulmonary artery acceleration time (PAAT; three measurements per animal per timepoint) in anti-NOTCH3 Ab 28042–treated rats versus controls. (D) Top: Representative M-mode recordings through the lateral tricuspid annulus, obtained from the apical four-chamber view, from the hearts of rats treated for 10 weeks with anti-NOTCH3 Ab 28042 versus PBS. Tricuspid annular plane systolic excursion (TAPSE) was measured from the end of diastole (lower bar) to the end of systole (top bar). Bottom: Graph of TAPSE (three measurements per animal per time point) in anti-NOTCH3 Ab 28042-treated rats (n = 10) versus controls (n = 10). (E) Representative parasternal short-axis midventricle echocardiograms of hearts, before and during treatment of rats with anti-NOTCH3 Ab 28042 compared to controls. The right ventricle is marked with blue arrows (rows 1–4) and yellow dotted lines (rows 2 and 4). LV, left ventricle. (F) Pulmonary angiograms of PBS-treated and anti-NOTCH3 Ab 28042-treated rats. Results are representative angiograms of the left upper lobe from 10 rats per group after 10 weeks of treatment. (G) Average right ventricular systolic pressure (RVSP) in rats before and during treatment with anti-NOTCH3 Ab 28042, compared to PBS-treated controls (15 readings per rat; 10 rats per group at each time point). (H) Averaged systolic blood pressure (SBP) in rats treated before and during treatment with anti-NOTCH3 Ab 28042, compared to PBS-treated controls (15 readings per rat; 10 rats per group at each time point). * p < 0.05. Figure modified and adapted from previous publication [14].
Figure 4
Figure 4
Rats were intraperitoneally injected with Sugen (20 mg/kg) followed by 3 weeks of hypoxia and 2 weeks of normoxia to induce pulmonary hypertension (PH). Subsequently, animals were treated with subcutaneous anti-NOTCH3 Ab 28042 (40 mg/kg) or placebo (PBS) under normoxic conditions for 10 weeks. (A) Western blot analysis of Jag-1, Notch3 ICD, and Hes-5 in the lungs of Sugen-hypoxia rats treated with anti-NOTCH3 Ab 28042 or PBS, normalized to Gapdh. (B) H&E-stained sections of small pulmonary arteries from lungs of rats at the beginning of treatment and during treatment with anti-NOTCH3 Ab 28042 or PBS. Results are representative sections from five rats per group at each time point. Scale bar, 25 μm. (C) Top: Representative continuous-wave Doppler signals measured from the right ventricular outflow tract before and during rat treatment with anti-NOTCH3 Ab 28042 compared to controls. Main pulmonary artery blood flow in PBS-treated rats showed shortened acceleration to peak velocity and midsystolic notching (yellow arrows), indicative of elevated pulmonary vascular resistance. Bottom: Graph of pulmonary artery acceleration time (PAAT; three measurements per animal per timepoint) in anti-NOTCH3 Ab 28042–treated rats versus controls. (D) Top: Representative M-mode recordings through the lateral tricuspid annulus, obtained from the apical four-chamber view, from the hearts of rats treated for 10 weeks with anti-NOTCH3 Ab 28042 versus PBS. Tricuspid annular plane systolic excursion (TAPSE) was measured from the end of diastole (lower bar) to the end of systole (top bar). Bottom: Graph of TAPSE (three measurements per animal per time point) in anti-NOTCH3 Ab 28042-treated rats (n = 10) versus controls (n = 10). (E) Representative parasternal short-axis midventricle echocardiograms of hearts, before and during treatment of rats with anti-NOTCH3 Ab 28042 compared to controls. The right ventricle is marked with blue arrows (rows 1–4) and yellow dotted lines (rows 2 and 4). LV, left ventricle. (F) Pulmonary angiograms of PBS-treated and anti-NOTCH3 Ab 28042-treated rats. Results are representative angiograms of the left upper lobe from 10 rats per group after 10 weeks of treatment. (G) Average right ventricular systolic pressure (RVSP) in rats before and during treatment with anti-NOTCH3 Ab 28042, compared to PBS-treated controls (15 readings per rat; 10 rats per group at each time point). (H) Averaged systolic blood pressure (SBP) in rats treated before and during treatment with anti-NOTCH3 Ab 28042, compared to PBS-treated controls (15 readings per rat; 10 rats per group at each time point). * p < 0.05. Figure modified and adapted from previous publication [14].

Similar articles

Cited by

References

    1. Badagliacca R., Poscia R., Pezzuto B., Nocioni M., Mezzapesa M., Francone M., Giannetta E., Papa S., Gambardella C., Sciomer S., et al. Right ventricular remodeling in idiopathic pulmonary arterial hypertension: Adaptive versus maladaptive morphology. J. Heart Lung Transplant. 2015;34:395–403. doi: 10.1016/j.healun.2014.11.002. - DOI - PubMed
    1. Hardegree E.L., Sachdev A., Fenstad E.R., Villarraga H.R., Frantz R.P., McGoon M.D., Oh J.K., Ammash N.M., Connolly H.M., Eidem B.W., et al. Impaired left ventricular mechanics in pulmonary arterial hypertension: Identification of a cohort at high risk. Circ. Heart Fail. 2013;6:748–755. doi: 10.1161/circheartfailure.112.000098. - DOI - PubMed
    1. Farber H.W., Loscalzo J. Pulmonary arterial hypertension. N. Engl. J. Med. 2004;351:1655–1665. doi: 10.1056/NEJMra035488. - DOI - PubMed
    1. Steffes L.C., Froistad A.A., Andruska A., Boehm M., McGlynn M., Zhang F., Zhang W., Hou D., Tian X., Miquerol L., et al. A Notch3-Marked Subpopulation of Vascular Smooth Muscle Cells Is the Cell of Origin for Occlusive Pulmonary Vascular Lesions. Circulation. 2020;142:1545–1561. doi: 10.1161/circulationaha.120.045750. - DOI - PMC - PubMed
    1. Humbert M., Guignabert C., Bonnet S., Dorfmüller P., Klinger J.R., Nicolls M.R., Olschewski A.J., Pullamsetti S.S., Schermuly R.T., Stenmark K.R., et al. Pathology and pathobiology of pulmonary hypertension: State of the art and research perspectives. Eur. Respir. J. 2019;53:1801887. doi: 10.1183/13993003.01887-2018. - DOI - PMC - PubMed

MeSH terms

LinkOut - more resources