Randomized Controlled Trial
. 2024 May 22;16(11):1571.
doi: 10.3390/nu16111571.

Prebiotic Treatment in Patients with Nonalcoholic Fatty Liver Disease (NAFLD)-A Randomized Pilot Trial

Affiliations
Randomized Controlled Trial

Prebiotic Treatment in Patients with Nonalcoholic Fatty Liver Disease (NAFLD)-A Randomized Pilot Trial

Naama Reshef et al. Nutrients. .

Abstract

Several studies show that gut microbiotas in patients with nonalcoholic fatty liver disease (NAFLD) differ from those in a healthy population, suggesting that this alteration plays a role in NAFLD pathogenesis. We investigated whether prebiotic administration affects liver fat content and/or liver-related and metabolic parameters. Patients with NAFLD and metabolic syndrome (age: 50 ± 11; 79% men) were randomized to receive either 16 g/day of prebiotic (ITFs-inulin-type fructans) (n = 8) or placebo (maltodextrin) (n = 11) for 12 weeks. Patients were instructed to maintain a stable weight throughout the study. Liver fat content (measured by H1MRS), fecal microbiota, and metabolic, inflammatory, and liver parameters were determined before and after intervention. Fecal samples from patients who received the prebiotic had an increased content of Bifidobacterium (p = 0.025), which was not observed with the placebo. However, the baseline and end-of-study liver fat contents did not change significantly in the prebiotic and placebo groups, neither did the liver function tests' metabolic and inflammatory mediators, including fibroblast growth factor-19 and lipopolysaccharide-binding protein. Body weight remained stable in both groups. These findings suggest that prebiotic treatment without weight reduction is insufficient to improve NAFLD.

Keywords: NAFLD; fibroblast growth factor; lipopolysaccharide; microbiota; prebiotic.


Conflict of interest statement

The authors declare no conflict of interest.

Figures

Figure 1
Figure 1
Microbial composition at baseline across the treatment groups. Mean relative abundances (RAs) are shown at the (a) phylum level and (b) family level. Taxa are color coded according to the following phylogenetic lineages: beige for Euryarcheota; gray for Actinobacteriota; brown for Bacteroidota; and violet for Proteobacteria. The Firmicutes phylum, because of its diversity, was further coded at the class/order level, as follows: families belonging to Bacilli are shown in purple; Veillonellales–Selenomonadales in pink; Oscillospirales in green; Lachnospirales in blue; and other Clostridia in cyan. Only taxa with a mean RA of 0.005 or higher (phylum level), of 0.01 or higher (family level) are shown.
Figure 2
Figure 2
Microbial compositions at baseline and at 12 weeks for the prebiotic and placebo groups. Bars represent the mean relative abundances of the microbial families and are color coded according to the following phylogenetic lineages: gray for families belonging to the Actinobacteria class; brown for Bacteroidia; purple for Bacilli; and pink for Veillonellales–Selenomonadales. Firmicutes are subdivided into green (for Oscillospirales), blue (Lachnospirales), and cyan (other Clostridia). Only families with a mean RA of 0.01 or higher are shown.
Figure 3
Figure 3
Microbial composition at baseline and at 12 weeks per patient. The microbial composition is highly personalized and temporally stable. The relative abundances of the microbial families are shown per patient, at baseline, and at 12 weeks. Each panel represents one patient. The color coding of the families represents the bacterial lineage, as in Figure 1 and Figure 2. Across all samples only families with an RA of 0.02 or higher are shown.
Figure 4
Figure 4
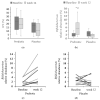
Bifidobacterium and LFC in both treatment groups. Variables in (a,b) are represented by box-and-whisker plots. The bold lines represent medians. (a) LFC; (b) relative abundance of Bifidobacterium; (c) subject-specific response of the Bifidobacterium relative abundance before and after the prebiotic treatment; (d) subject-specific response of Bifidobacterium before and after the placebo treatment. * Prebiotic group at week 12 vs. baseline, p = 0.025; # Week-12 prebiotic group vs. placebo group, p = 0.02. LFC = liver fat content. Different shades of gray were used for better visibility and distinction of individual trends for each participant.
Figure 5
Figure 5
FGF-19 and LPS-BP in both of the treatment groups. Variables in (a,b) are represented by the box-and-whisker plots. The bold lines represent medians. LPS-BP (a) and FGF-19 (b) at baseline and at week 12 of prebiotic or placebo intake, (both p > 0.05). LPS-BP = lipopolysaccharide-binding protein; FGF-19 = fibroblast growth factor-19.

References

    1. Teng M.L., Ng C.H., Huang D.Q., Chan K.E., Tan D.J., Lim W.H., Yang J.D., Tan E., Muthiah M.D. Global incidence and prevalence of nonalcoholic fatty liver disease. Clin. Mol. Hepatol. 2023;29:S32–S42. doi: 10.3350/cmh.2022.0365. - DOI - PMC - PubMed
    1. Calzadilla Bertot L., Adams L.A. The Natural Course of Non-Alcoholic Fatty Liver Disease. Int. J. Mol. Sci. 2016;17:774. doi: 10.3390/ijms17050774. - DOI - PMC - PubMed
    1. Malnick S.D.H., Beergabel M., Knobler H. Non-alcoholic fatty liver: A common manifestation of a metabolic disorder. QJM. 2003;96:699–709. doi: 10.1093/qjmed/hcg120. - DOI - PubMed
    1. Ramírez-Mejía M.M., Qi X., Abenavoli L., Romero-Gómez M., Eslam M., Méndez-Sánchez N. Metabolic dysfunction: The silenced connection with fatty liver disease. Ann. Hepatol. 2023;28:101138. doi: 10.1016/j.aohep.2023.101138. - DOI - PubMed
    1. Chan W.-K., Chuah K.-H., Rajaram R.B., Lim L.-L., Ratnasingam J., Vethakkan S.R. Metabolic Dysfunction-Associated Steatotic Liver Disease (MASLD): A State-of-the-Art Review. J. Obes. Metab. Syndr. 2023;32:197–213. doi: 10.7570/jomes23052. - DOI - PMC - PubMed

Publication types