. 2024 May 23;16(11):1579.
doi: 10.3390/nu16111579.

Distinct Gut Microbiota and Arachidonic Acid Metabolism in Obesity-Prone and Obesity-Resistant Mice with a High-Fat Diet

Affiliations

Distinct Gut Microbiota and Arachidonic Acid Metabolism in Obesity-Prone and Obesity-Resistant Mice with a High-Fat Diet

Huixia Zhang et al. Nutrients. .

Abstract

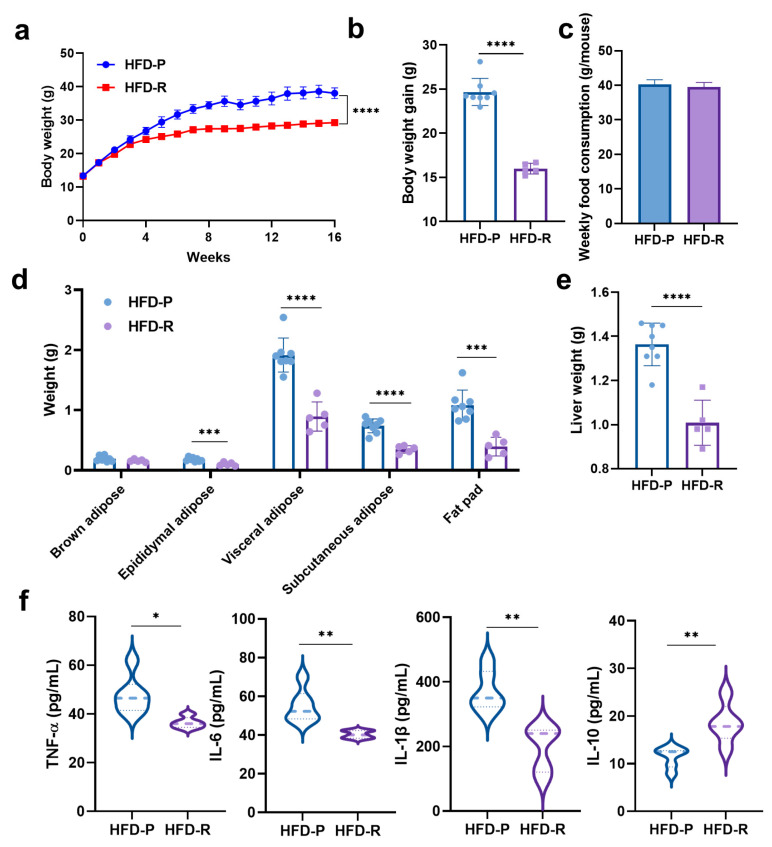
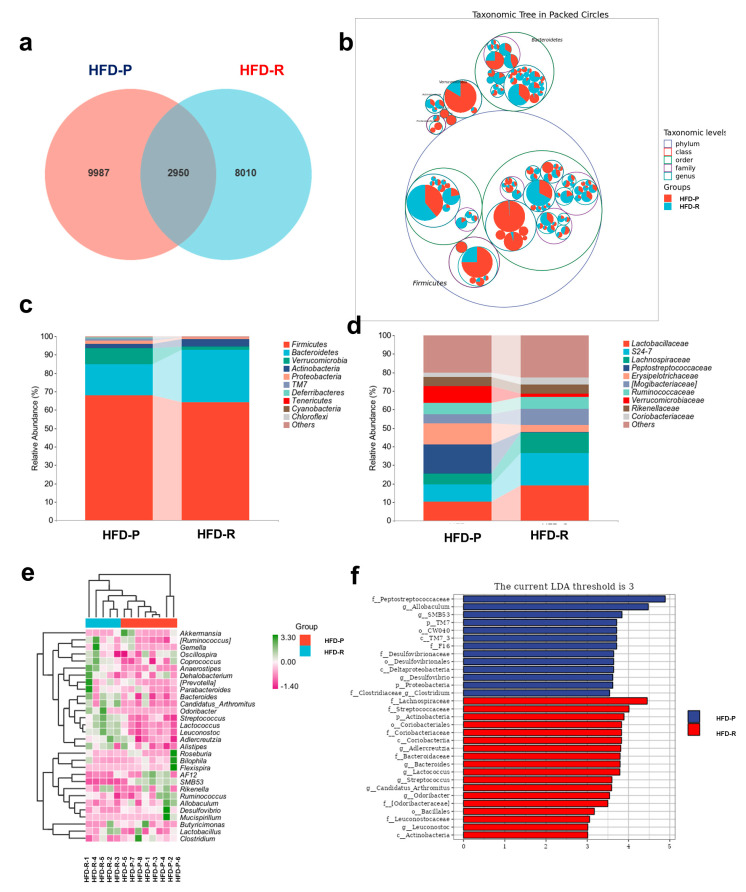
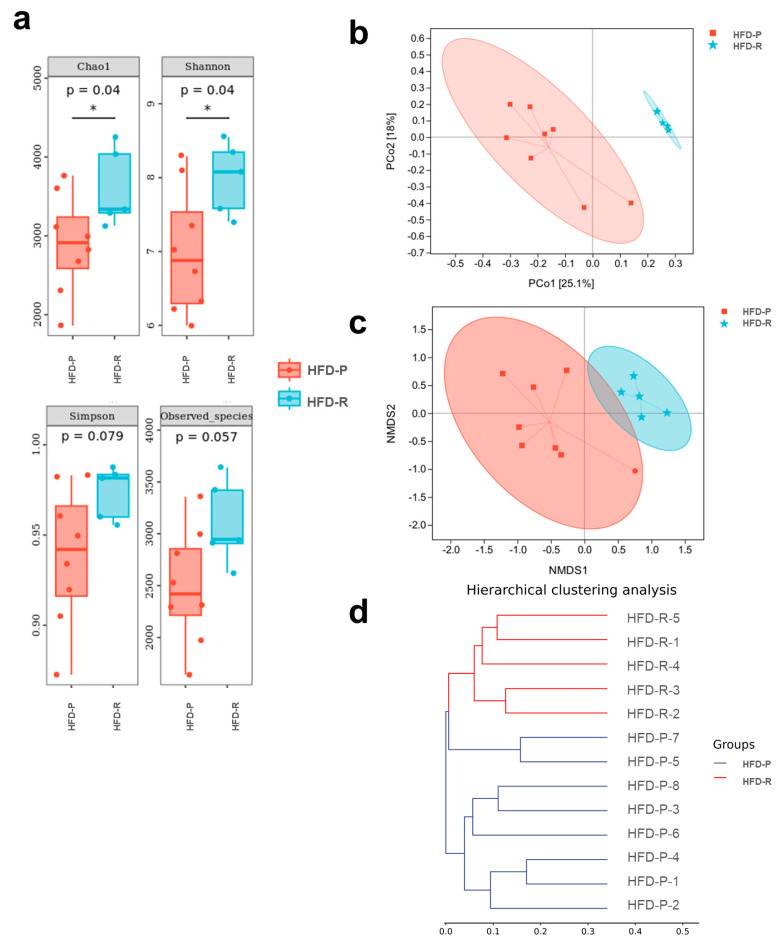
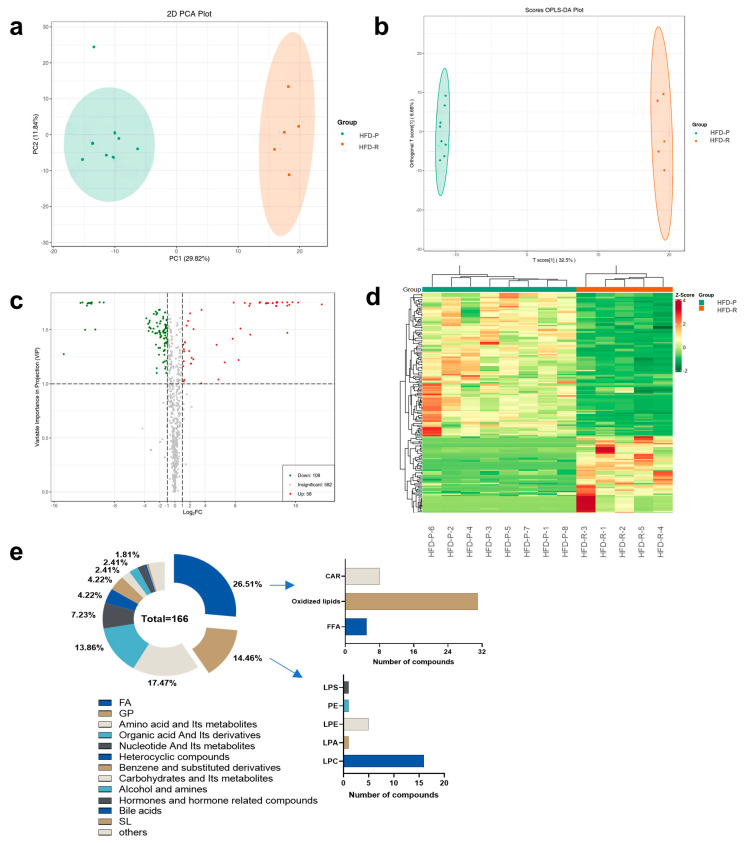
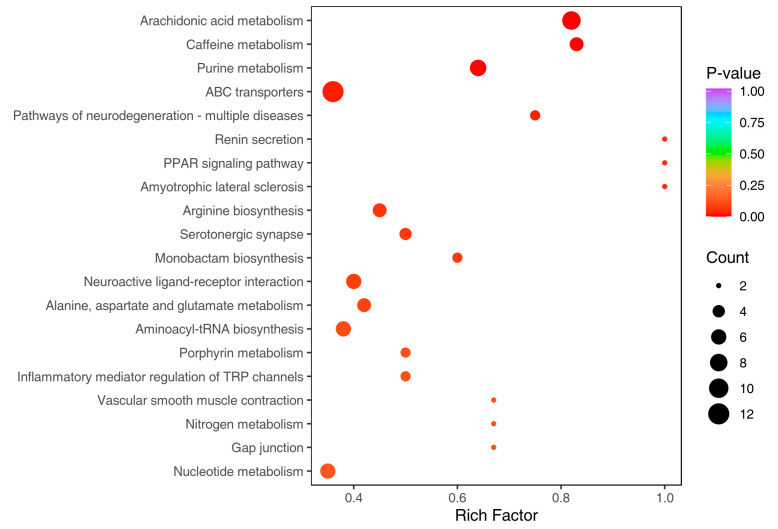
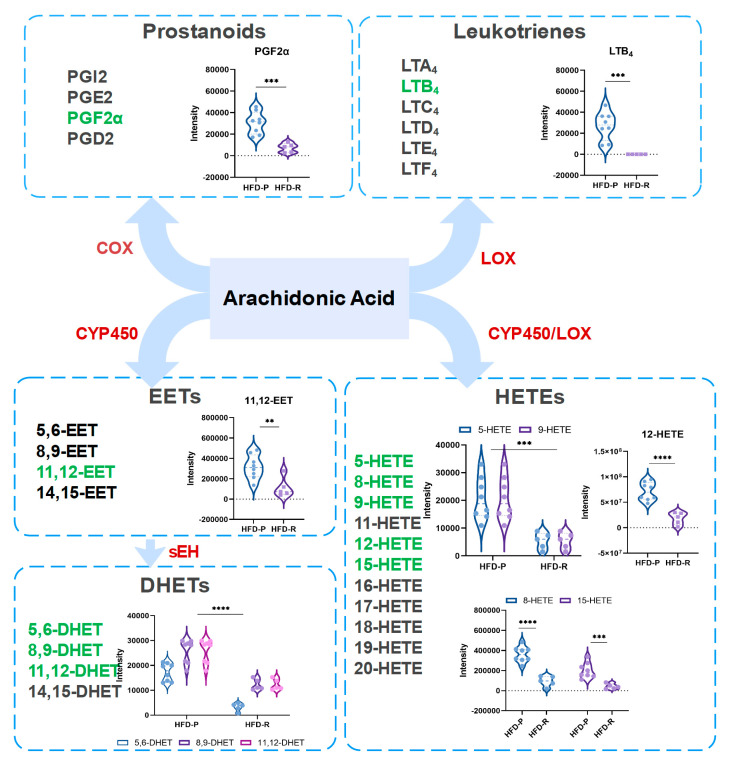
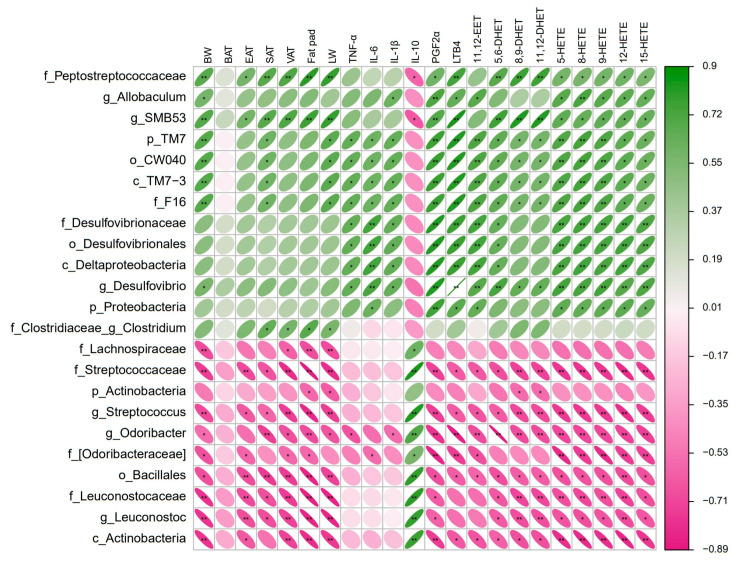
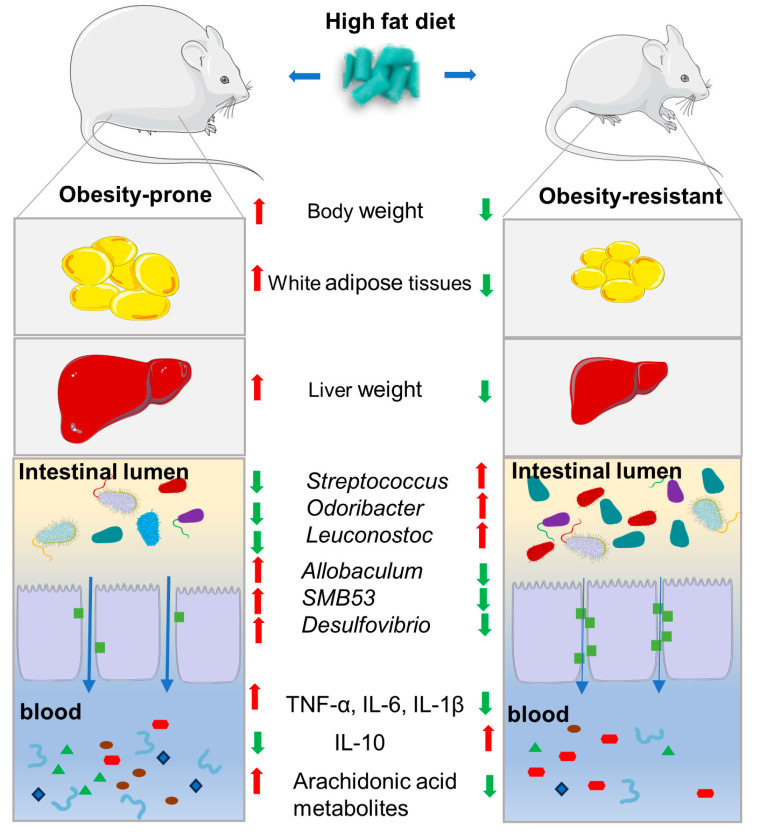
An imbalance of energy intake and expenditure is commonly considered as the fundamental cause of obesity. However, individual variations in susceptibility to obesity do indeed exist in both humans and animals, even among those with the same living environments and dietary intakes. To further explore the potential influencing factors of these individual variations, male C57BL/6J mice were used for the development of obesity-prone and obesity-resistant mice models and were fed high-fat diets for 16 weeks. Compared to the obesity-prone mice, the obesity-resistant group showed a lower body weight, liver weight, adipose accumulation and pro-inflammatory cytokine levels. 16S rRNA sequencing, which was conducted for fecal microbiota analysis, found that the fecal microbiome's structural composition and biodiversity had changed in the two groups. The genera Allobaculumbiota, SMB53, Desulfovibrio and Clostridium increased in the obesity-prone mice, and the genera Streptococcus, Odoribacter and Leuconostoc were enriched in the obesity-resistant mice. Using widely targeted metabolomics analysis, 166 differential metabolites were found, especially those products involved in arachidonic acid (AA) metabolism, which were significantly reduced in the obesity-resistant mice. Moreover, KEGG pathway analysis exhibited that AA metabolism was the most enriched pathway. Significantly altered bacteria and obesity-related parameters, as well as AA metabolites, exhibited strong correlations. Overall, the phenotypes of the obesity-prone and obesity-resistant mice were linked to gut microbiota and AA metabolism, providing new insight for developing an in-depth understanding of the driving force of obesity resistance and a scientific reference for the targeted prevention and treatment of obesity.

Keywords: arachidonic acid metabolism; gut microbiota; obesity prone; obesity resistant; widely targeted metabolomics.


Conflict of interest statement

The authors declare no conflicts of interest.

Figures

Figure 1
Figure 1
Effects on body weight and physiological properties of obesity-prone and obesity-resistant mice induced by high-fat diets (i.e., obesity-prone, HFD-P; obesity-resistant, HFD-R). (a) Body weight–time curves; (b) body weight gain; (c) weekly food consumption; (d) different adipose tissues weight; (e) liver weight; (f) levels of serum inflammatory cytokines in mice. Data are presented as means ± SD for figure (ae) and medians for figure (f) (HFD-P, n = 8 mice/group; HFD-R, n = 5 mice/group). Statistical analysis used unpaired t-test. * p < 0.05; ** p < 0.01; *** p < 0.001; **** p < 0.0001.
Figure 2
Figure 2
Distinct fecal microbiota composition of obesity-prone (HFD-P) and obesity-resistant (HFD-R) mice with high-fat diets. (a) Venn diagram; (b) taxonomic tree in packed circles. On the base of the tree map of fecal microbiota classification, the abundance of each ASV group was added to the map with a pie chart. The largest circle represents phylum level, and the gradually shrinking circle represents class, order, family and genus level. The innermost dot area represents the abundance and the composition proportion of ASVs in each group; (c) relative abundance of dominant bacteria at the phylum taxa level; (d) relative abundance of dominant bacteria at the family taxa level; (e) heatmap of top 30 bacteria at the genus taxa level; (f) LefSe analysis of fecal microbiota.
Figure 3
Figure 3
Differences in microbial diversity in feces between the obesity-prone (HFD-P) and obesity-resistant (HFD-R) mice. (a) Alpha diversity based on the indexes of Chao1, Shannon, Simpson and observed species. Dunn’s test was used for statistical analysis. * p < 0.05; (b) principal coordinates analysis (PCoA) plot based on Bray–Curtis distance matrices; (c) nonmetric multidimensional scaling (NMDS) plot based on Bray–Curtis distance matrices; (d) hierarchical clustering analysis.
Figure 4
Figure 4
Different metabolic profiles between obesity-prone and obesity-resistant group. (a) PCA plot; (b) OPLS–DA plot; (c) volcano plot for differential metabolites screening; (d) cluster heatmap of differential metabolites; (e) pie chart for differential metabolites composition. fatty acyls, FA; glycerophospholipids, GP; sphingolipids, SL; CAR; free fatty acid, FFA; Lyso-phosphatidylserine, LPS; Phosphatidylethanolamine, PE; Lyso-phosphatidic acid, LPE; Lyso-phosphatidic acid, LPA; Lyso-phosphatidylcholine, LPC.
Figure 5
Figure 5
KEGG pathway enrichment analysis.
Figure 6
Figure 6
Arachidonic acid metabolism pathway analysis. Cyclooxygenase, COX; lipoxygenase, LOX; cytochrome P450, CYP450; prostanoids, PGs; leukotriene, LT; epoxyeicosatrienoic acids, EETs; dihydroxydocosatrinoic acids, DHETs; hydroxyeicosatetraenoic acids, HETEs. Unpaired t-test was used for statistical analysis. ** p < 0.01; *** p < 0.001; **** p < 0.0001.
Figure 7
Figure 7
Heatmap for correlation analysis between differential microbiota and obesity-related parameters. The correlation coefficient r is shown in color. Positive correlation is shown in green; negative correlation is shown in pink. The darker the color, the stronger the correlation. * indicates p < 0.05, and ** indicates p < 0.01.
Figure 8
Figure 8
A schematical diagram of differences between obesity-prone and obesity-resistant mice. The red arrow means up-regulated; the green arrow means down-regulated.

Similar articles

Cited by

References

    1. Shang A., Gan R.Y., Xu X.Y., Mao Q.Q., Zhang P.Z., Li H.B. Effects and mechanisms of edible and medicinal plants on obesity: An updated review. Crit. Rev. Food Sci. Nutr. 2021;61:2061–2077. doi: 10.1080/10408398.2020.1769548. - DOI - PubMed
    1. Guo X., Zhang T., Shi L., Gong M., Jin J., Zhang Y., Liu R., Chang M., Jin Q., Wang X. The relationship between lipid phytochemicals, obesity and its related chronic diseases. Food Funct. 2018;9:6048–6062. doi: 10.1039/C8FO01026A. - DOI - PubMed
    1. Overstreet A.C., Grayson B.E., Boger A., Bakke D., Carmody E.M., Bales C.E., Paski S.C., Murphy S.F., Dethlefs C.R., Shannon K.J., et al. Gastrokine-1, an anti-amyloidogenic protein secreted by the stomach, regulates diet-induced obesity. Sci. Rep. 2021;11:9477. doi: 10.1038/s41598-021-88928-8. - DOI - PMC - PubMed
    1. Nam M., Choi M.S., Jung S., Jung Y., Choi J.Y., Ryu D.H., Hwang G.S. Lipidomic profiling of liver tissue from obesity-prone and obesity-resistant mice fed a high fat diet. Sci. Rep. 2015;5:16984. doi: 10.1038/srep16984. - DOI - PMC - PubMed
    1. Bluher M. Obesity: Global epidemiology and pathogenesis. Nat. Rev. Endocrinol. 2019;15:288–298. doi: 10.1038/s41574-019-0176-8. - DOI - PubMed