. 2024 May 31;13(11):3245.
doi: 10.3390/jcm13113245.

A Lower Remote Dielectric Sensing Value Was Associated with Hypovolemia and Worse Clinical Outcomes

Affiliations

A Lower Remote Dielectric Sensing Value Was Associated with Hypovolemia and Worse Clinical Outcomes

Teruhiko Imamura et al. J Clin Med. .

Abstract

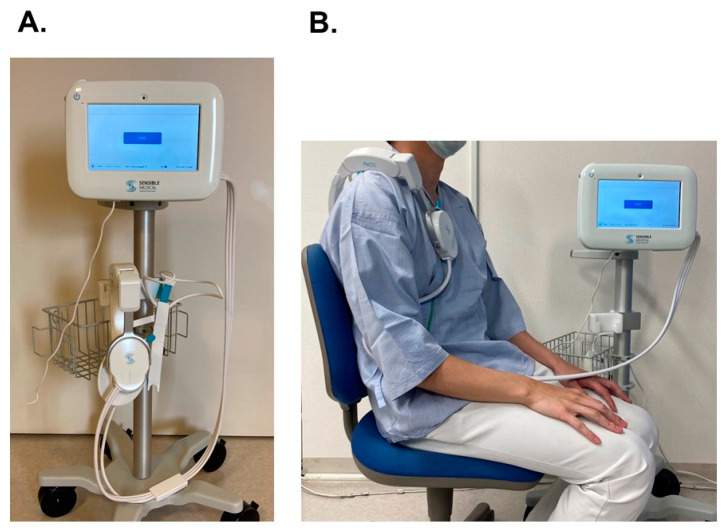
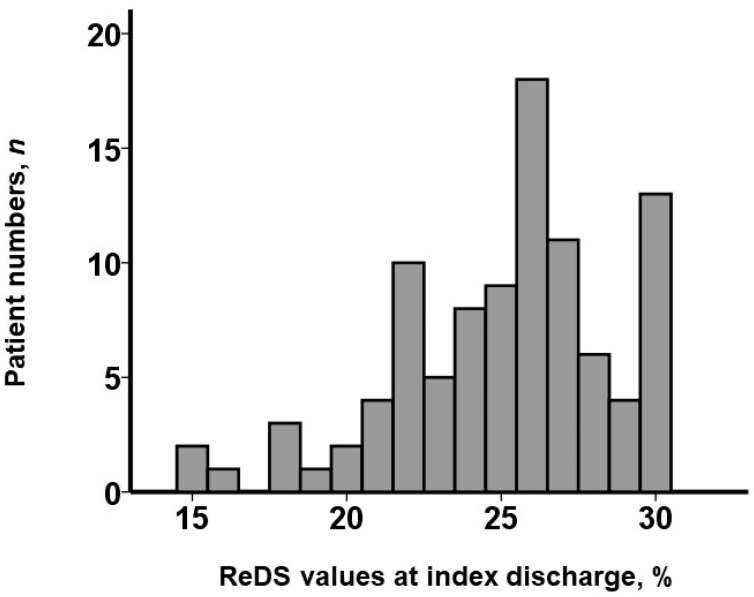
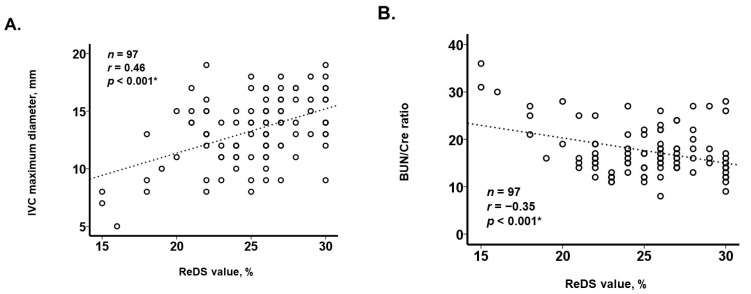
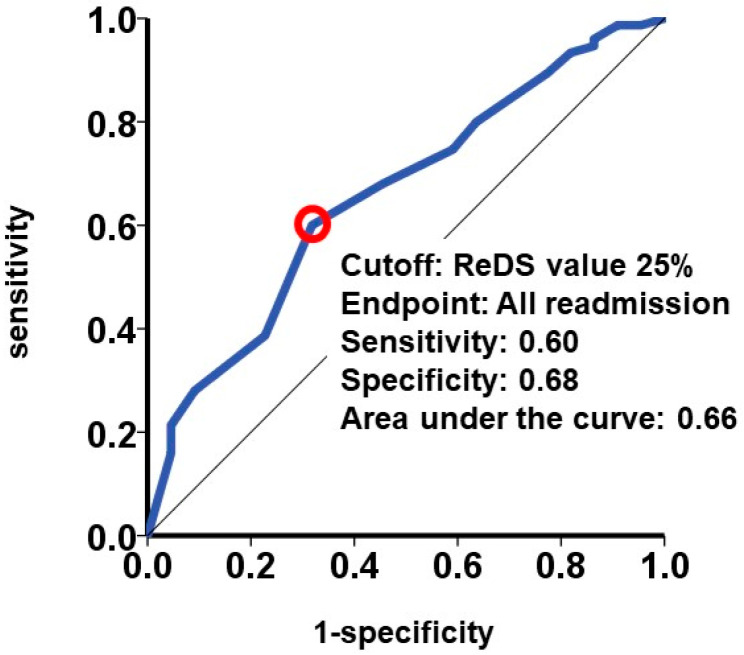
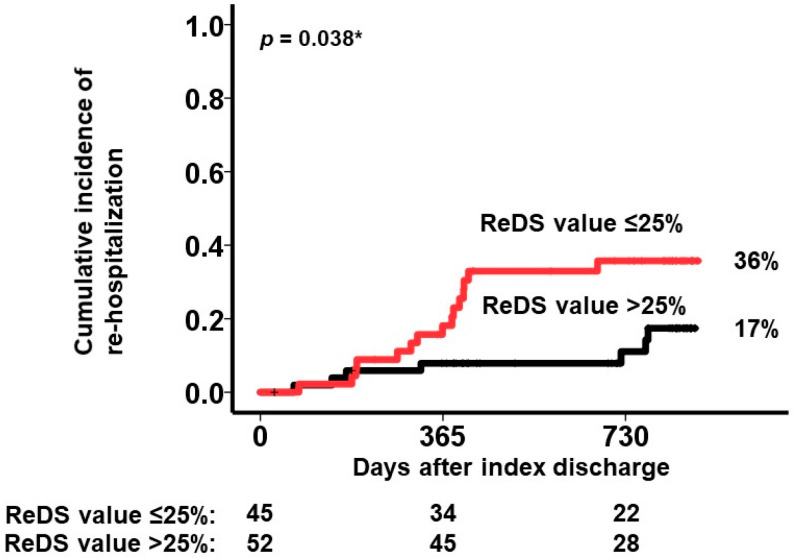
Background: Remote dielectric sensing (ReDS) systems can estimate the amount of lung fluid non-invasively and easily without expert techniques. The correlation between the elevated ReDS value and other modalities that estimate pulmonary congestion has been validated. The clinical implications of lower ReDS values, which may indicate hypovolemia, remain unknown. Methods: A total of 138 patients who were hospitalized for various cardiovascular-related problems and underwent ReDS value measurements at the index discharge in a blinded manner to the attending clinicians were eligible for inclusion. Patients with ReDS values > 30%, indicating the presence of pulmonary congestion, were excluded. The prognostic impact of lower ReDS values on all-cause readmission after index discharge was evaluated. Results: A total of 97 patients were included. The median age was 78 years, and 48 were men. The median ReDS value at index discharge was 26% (23%, 27%). A lower ReDS value correlated with smaller inferior vena cava maximum diameters (r = 0.46, p < 0.001) and higher blood urea nitrogen/creatinine ratios (r = -0.35, p < 0.001). A lower ReDS value (≤25%) was associated with a risk of all-cause readmissions with an unadjusted hazard ratio of 2.68 (95% confidence interval 1.09-6.59, p = 0.031) and an adjusted hazard ratio of 2.30 (95% confidence interval 0.92-5.78, p = 0.076). Its calculated cutoff of 25% significantly stratified the cumulative incidence of the primary outcome (36% versus 17%, p = 0.038). Conclusions: A lower ReDS value may indicate hypovolemia and be associated with the risk of all-cause readmission in patients hospitalized for cardiovascular diseases.

Keywords: congestion; diuretics; heart failure.


Conflict of interest statement

The authors declare no conflicts of interest.

Figures

Figure 1
Figure 1
ReDS system: the ReDS device consists of a wearable sensor and monitor (A). A patient is asked to sit on a chair with their back against the seat while breathing naturally (B). The patient wears a ReDS sensor and waits for approximately 60 s. Here, the measurement does not require being naked. The ReDS value, a representative of the percentage of lung fluid, is displayed on the screen. The manufacturer-recommended normal range of the ReDS value is between 20% and 35%, although further studies are warranted to validate optimal cutoffs of normal ranges.
Figure 2
Figure 2
Distribution of ReDS value at index discharge: ReDS values were distributed widely, ranging between 15% and 30%. Of note, fluid volume was controlled by referencing conventional modalities, except for the ReDS value, before index discharge.
Figure 3
Figure 3
Correlation of lower ReDS values with smaller IVC maximum diameters (A) and with higher BUN/Cre ratios (B), respectively. A lower ReDS value had a mild correlation with a smaller IVC maximum diameter (A). A lower ReDS value had a mild correlation with a higher BUN/Cre ratio (B). IVC, inferior vena cava; BUN, blood urea nitrogen; Cre, creatinine. * p < 0.05 by Pearson’s correlation coefficient.
Figure 4
Figure 4
Calculation of the cutoff of the ReDS value for predicting the primary outcome. The primary outcome was defined as all-cause readmission after index discharge.
Figure 5
Figure 5
Cumulative incidence of the primary outcome stratified by the cutoff of the ReDS value at 25%. The individuals with ReDS values ≤ 25% had a significantly higher cumulative incidence of the primary outcome (red curve) compared with their counterparts (black curve). * p < 0.05 by log-rank test.

Similar articles

References

    1. Cowen L.E., Hodak S.P., Verbalis J.G. Age-Associated Abnormalities of Water Homeostasis. Endocrinol. Metab. Clin. N. Am. 2023;52:277–293. doi: 10.1016/j.ecl.2022.11.002. - DOI - PubMed
    1. Miller W.L. Fluid Volume Homeostasis in Heart Failure: A Tale of 2 Circulations. J. Am. Heart Assoc. 2022;11:e026668. doi: 10.1161/JAHA.122.026668. - DOI - PMC - PubMed
    1. Bart N.K., Kotlyar E., Keogh A.M. Pulmonary haemodynamics and pulmonary congestion: Where are we now? Eur. Heart J. 2022;43:4515. doi: 10.1093/eurheartj/ehac499. - DOI - PubMed
    1. Lindow T., Quadrelli S., Ugander M. Noninvasive Imaging Methods for Quantification of Pulmonary Edema and Congestion: A Systematic Review. JACC Cardiovasc. Imaging. 2023;16:1469–1484. doi: 10.1016/j.jcmg.2023.06.023. - DOI - PubMed
    1. Jain C.C., Tschirren J., Reddy Y.N.V., Melenovsky V., Redfield M., Borlaug B.A. Subclinical Pulmonary Congestion and Abnormal Hemodynamics in Heart Failure with Preserved Ejection Fraction. JACC Cardiovasc. Imaging. 2022;15:629–637. doi: 10.1016/j.jcmg.2021.09.017. - DOI - PMC - PubMed

LinkOut - more resources