. 2024 May 30;16(11):2071.
doi: 10.3390/cancers16112071.

Overlapping Stromal Alterations in Myeloid and Lymphoid Neoplasms

Affiliations

Overlapping Stromal Alterations in Myeloid and Lymphoid Neoplasms

Lucienne Bogun et al. Cancers (Basel). .

Abstract

Myeloid and lymphoid neoplasms share the characteristics of potential bone marrow infiltration as a primary or secondary effect, which readily leads to hematopoietic insufficiency. The mechanisms by which clonal malignant cells inhibit normal hematopoietic stem and progenitor cells (HSPCs) in the bone marrow (BM) have not been unraveled so far. Given the pivotal role of mesenchymal stromal cells (MSCs) in the regulation of hematopoiesis in the BM niche it is assumed that MSCs also play a relevant role in the pathogenesis of hematological neoplasms. We aimed to identify overlapping mechanisms in MSCs derived from myeloid and lymphoid neoplasms contributing to disease progression and suppression of HSPCs to develop interventions that target these mechanisms. MSCs derived from healthy donors (n = 44) and patients diagnosed with myeloproliferative neoplasia (n = 11), myelodysplastic syndromes (n = 16), or acute myeloid leukemia (n = 25) and B-Non-Hodgkin lymphoma (n = 9) with BM infiltration and acute lymphoblastic leukemia (n = 9) were analyzed for their functionality and by RNA sequencing. A reduced growth and differentiation capacity of MSCs was found in all entities. RNA sequencing distinguished both groups but clearly showed overlapping differentially expressed genes, including major players in the BMP/TGF and WNT-signaling pathway which are crucial for growth, osteogenesis, and hematopoiesis. Functional alterations in healthy MSCs were inducible by exposure to supernatants from malignant cells, implicating the involvement of these factors in disease progression. Overall, we were able to identify overlapping factors that pose potential future therapeutic targets.

Keywords: ALL; AML; MDS; MPN; MSC; NHL; RNA sequencing; bone marrow microenvironment; hematopoietic insufficiency; lymphoid neoplasms; myeloid neoplasms; osteogenesis.


Conflict of interest statement

The authors declare that the research was conducted in the absence of any commercial or financial relationships that could be construed as a potential conflict of interest The author Felix Bormann is affiliated with Bioinformatics.Expert UG but has no potential interest relationship. The funder was not involved in the study design, collection, analysis, interpretation of data, the writing of this article or the decision to submit it for publication.

Figures

Figure 1
Figure 1
Growth capacity and cellular senescence of MSCs from myeloid and lymphoid neoplasms. (A) Representative micrographs of phenotype from Healthy-, MPN-, MDS-, AML-, ALL-, and NHL-derived MSCs with scale bars indicating 100 µm are shown. Bar charts of the CFU-F activity of MSCs from Healthy-, MPN-, MDS-, AML-, ALL-, and NHL-derived MSCs. (B) Representative micrographs of number of cellular senescence visualized in blue from native Healthy-, MPN-, MDS-, AML-, ALL-, and NHL-derived MSCs in Passage 3 after the ß-galactosidase staining. Scale bars indicating 100 µm are shown. Asterisks display p-values * p < 0.05, **** p < 0.0001.
Figure 2
Figure 2
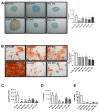
Chondrogenic and osteogenic differentiation capacity of MSCs derived from patients with myeloid and lymphoid neoplasms. (A) Representative micrographs of proteoglycan after Safranin O staining of chondrogenic-induced MSCs after 21 days. Scale bars indicating 100 µm are shown. Right side: area size in µm of chondrogenic pellets after 21 days of induction was measured and presented as bar charts of the respective MSC group in comparison to healthy MSCs (white bar). (B) Osteogenic differentiation was induced for 14 days and stained with Alizarin Red. Representative micrographs of the osteogenic potential of MSCs. Scale bars indicating 100 µm are shown. Right side: Bar charts represent staining intensity of observed osteogenic differentiation. Osteogenic differentiation capacity was graded according to the microscope as previously described [10]. Bar charts of the mRNA expression level of osteogenic factors OSTERIX (C), OSTEOCALCIN (D), and (E) TPM values from our sequencing data of Integrin Binding Sialoprotein (IBSP). For all other experiments, results are expressed as Mean ± SEM. Asterisks display p-values * p < 0.05, ** p < 0.01, *** p < 0.001, **** p < 0.0001.
Figure 3
Figure 3
Hematopoietic supporting capacity of MSCs from myeloid and lymphoid neoplasms. Box plots of mRNA expression of hematopoietic factors SCF (A) and SDF-1 (CXCL12) (B) in healthy-, MPN-, MDS-, AML-, ALL-, and NHL-derived MSCs. mRNA expression was measured by qRT-PCR in healthy MSCs (n = 22), MPN MSCs (n = 14), MDS MSCs (n = 10), AML MSCs (n = 10), ALL MSCs (n = 7), and NHL MSCs (n = 4). (C) Box plots of long-term initiating cell (LTC-IC) assay frequency. Hematopoietic supporting capacity of MSCs derived from healthy and hematological neoplasms. Asterisks display p-values * p < 0.05, ** p < 0.01, *** p < 0.001, **** p < 0.0001.
Figure 4
Figure 4
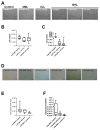
Exposure of healthy MSCs to conditioned media (CM) derived from cell lines and BM-MNCs from patients with myeloid and lymphoid neoplasms. (A) Representative micrographs of phenotype of healthy MSCs after co-culture with CM from cell line HL-60 (AML), cell line NALM-6 (ALL), MEC-1, MAVER-1, and K422 (all three NHL). Scale bars indicating 100 µm are shown. (B) Box plots present cell numbers of healthy MSCs after 3 days of co-culture with CM derived from cell lines. (C) Box plots demonstrate mRNA expression of osteogenic factor OSTEOCALCIN measured by qRT-PCR. (D) Representative micrographs of phenotype of healthy MSCs after co-culture with patient-derived CM from BM-derived MNCs for 3 days. Scale bars indicating 100 µm are shown. Calculated cell numbers of manipulated healthy MSCs after 3 days of co-culture are given in box plots. (E) Box plots present cell numbers of healthy MSCs after 3 days of co-culture with CM derived from patients’ BM MNCs. (F) mRNA expression of OSTEOCALCIN was measured in healthy MSCs after co-culture with respective patients BM-MNC CM by qRT-PCR. Asterisks display p-values * p < 0.05, *** p < 0.001.
Figure 5
Figure 5
RNA Sequencing. (A) Clinical parameters of patients’ characteristics, which were included in RNA sequencing. (B) Principal Component Analysis (PCA) of MSCs from Healthy (n = 5, black), MPN MSCs (n = 5, purple), MDS (n = 4, brown), AML (n = 4, yellow), B-ALL (n = 5, orange), and B-NHL (n = 4, green). (C,D) Venn diagrams of differentially expressed genes (FDR q-value ≤ 0.05) for MSCs from myeloid (left: MPN, MDS, and AML) and for MSCs from lymphoid (right: B-ALL and B-NHL) neoplasms with tables of overlapping differentially expressed genes of 263 in MSCs of myeloid neoplasms (MPN, MDS, and AML MSCs; left) and 196 in MSCs of lymphoid (B-ALL and B-NHL; right) neoplasms. Green highlighted genes indicate overlapping genes in all hematological neoplasms and. black highlighted genes were exclusively found in the respective group (myeloid or lymphoid) (TGFB1*, was significant in p-value 0.005, FDR q-value 0.1, B-ALL sample 2 exhibited a lower Transcript per million (TPM) expression of TGFB1 than all other samples).
Figure 5
Figure 5
RNA Sequencing. (A) Clinical parameters of patients’ characteristics, which were included in RNA sequencing. (B) Principal Component Analysis (PCA) of MSCs from Healthy (n = 5, black), MPN MSCs (n = 5, purple), MDS (n = 4, brown), AML (n = 4, yellow), B-ALL (n = 5, orange), and B-NHL (n = 4, green). (C,D) Venn diagrams of differentially expressed genes (FDR q-value ≤ 0.05) for MSCs from myeloid (left: MPN, MDS, and AML) and for MSCs from lymphoid (right: B-ALL and B-NHL) neoplasms with tables of overlapping differentially expressed genes of 263 in MSCs of myeloid neoplasms (MPN, MDS, and AML MSCs; left) and 196 in MSCs of lymphoid (B-ALL and B-NHL; right) neoplasms. Green highlighted genes indicate overlapping genes in all hematological neoplasms and. black highlighted genes were exclusively found in the respective group (myeloid or lymphoid) (TGFB1*, was significant in p-value 0.005, FDR q-value 0.1, B-ALL sample 2 exhibited a lower Transcript per million (TPM) expression of TGFB1 than all other samples).
Figure 6
Figure 6
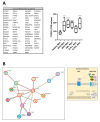
Overlapping differentially expressed genes in all hematological neoplasms affect cell processes. (A) Left side: Graphical overview of representative overlapping differentially expressed genes that were found in MSCs from all hematological neoplasms from overlapping genes in the respective group from green highlighted in Figure 5D. A total of 74 differentially overlapping genes were identified in all hematological neoplasms. Right side: Transcript per million (TPM) values of TGFB1 in MSCs from our RNA sequencing data. Asterisks display adjusted p-values *** p < 0.001, **** p < 0.0001. (B) A total of 14 of these 74 genes are directly linked and form a potential theoretical protein network to TGFB signaling as visualized by using the STRING database (B, right side). A protein network was generated with the STRING database (Version 12.0) and adapted. Blue-circled genes indicate downregulation and red-circled genes indicate upregulation of these genes in our RNA sequencing. Visualization of further genes from the “overlap all neoplasms” group, that are regulators or related to the WNT and BMP/TGFB signaling pathways as well as downstream targets of these signaling pathways such as PITX2, HAND2, or TBX15, that were found in all hematological neoplasms, were contrasted with healthy MSCs. These genes play crucial roles in ECM, differentiation, or hematopoiesis (TGFB1*, was significant in p-value 0.005, FDR q-value 0.1, B-ALL sample 2 exhibited a lower Transcript per million (TPM) expression of TGFB1 than all other samples). (C) Strong enrichment in genes related to osteogenesis or hematopoiesis in all MSC groups reflected by gene set enrichment analysis (GSEA). Normalized enrichment score (NES), p-value, and false discovery rate (FDR) are given.
Figure 6
Figure 6
Overlapping differentially expressed genes in all hematological neoplasms affect cell processes. (A) Left side: Graphical overview of representative overlapping differentially expressed genes that were found in MSCs from all hematological neoplasms from overlapping genes in the respective group from green highlighted in Figure 5D. A total of 74 differentially overlapping genes were identified in all hematological neoplasms. Right side: Transcript per million (TPM) values of TGFB1 in MSCs from our RNA sequencing data. Asterisks display adjusted p-values *** p < 0.001, **** p < 0.0001. (B) A total of 14 of these 74 genes are directly linked and form a potential theoretical protein network to TGFB signaling as visualized by using the STRING database (B, right side). A protein network was generated with the STRING database (Version 12.0) and adapted. Blue-circled genes indicate downregulation and red-circled genes indicate upregulation of these genes in our RNA sequencing. Visualization of further genes from the “overlap all neoplasms” group, that are regulators or related to the WNT and BMP/TGFB signaling pathways as well as downstream targets of these signaling pathways such as PITX2, HAND2, or TBX15, that were found in all hematological neoplasms, were contrasted with healthy MSCs. These genes play crucial roles in ECM, differentiation, or hematopoiesis (TGFB1*, was significant in p-value 0.005, FDR q-value 0.1, B-ALL sample 2 exhibited a lower Transcript per million (TPM) expression of TGFB1 than all other samples). (C) Strong enrichment in genes related to osteogenesis or hematopoiesis in all MSC groups reflected by gene set enrichment analysis (GSEA). Normalized enrichment score (NES), p-value, and false discovery rate (FDR) are given.
Figure 7
Figure 7
Ingenuity Pathway Analysis (IPA) and gene set enrichment analysis (GSEA) of native MSCs from Healthy, MPN, MDS, AML, ALL, and NHL MSCs. Tables of Ingenuity Pathway Analysis (IPA) and the prediction of potential upstream regulators from native MSCs from MPN, MDS, AML, B-ALL, and B-NHL contrasted to healthy and waterfall Plots from GSEA of native MSCs from Healthy, MPN, MDS, AML, B-ALL, and B-NHL MSCs. p-value, FDR q-value, and normalized enrichment score (NES) are included.
Figure 8
Figure 8
Graphical overview of representative exclusively differentially expressed genes from our RNA sequencing data in the myeloid and lymphoid group that are clearly assigned to the BMP/TGFB signaling pathway. (A) Illustration of representative and exclusively differentially expressed genes only in the “all myeloid group” (MPN, MDS, AML) and the exclusively overlapping differentially expressed genes only in the “all lymphoid group” (B-ALL, B-NHL) (from Figure 5D, black highlighted genes). Translation of differentially expressed genes from our mRNA sequencing data (FDR q-value < 0.05) from overlapping genes in all myeloid and separately in all lymphoid groups to a correlation and potential protein network of these genes as generated with STRING database (Version 12.0). STRING visualization was adapted starting from TGFB1 as is highlighted with a circle. In the “all myeloid group”, 52 out of 192 exclusively differentially expressed genes in this group clearly show a direct correlation to the TGFB-signaling cascade based on current data in STRING (Version 12.0) (B, left side). In the “all lymphoid group”, 26 out of 123 exclusively differentially expressed genes in this group clearly show a direct correlation to the TGFB-signaling cascade based on current data in STRING (Version 12.0) (B, right side). Overrepresented genes are red-circled, and underrepresented genes are blue-circled. (B) Graphical overview of further exclusively differentially expressed genes in the respective group, myeloid or lymphoid group (contrasted to healthy) that are regulators or related to the WNT and BMP/TGFB signaling pathways as well as downstream targets of these signaling pathways exclusively in the respective group. (TGFB1*, was significant in p-value 0.005, FDR q-value 0.1, B-ALL sample 2 exhibited a lower Transcript per million (TPM) expression of TGFB1 than all other samples). (C) Illustration of representative and exclusively overlapping differentially expressed genes in the “all myeloid group” and the “all lymphoid group” and the relationship to the canonical and non-canonical BMP/TGFB signaling pathway. Illustration of DESeq2 Data (p-adjusted < 0.05) reveals a clear shift to SMAD-dependent BMP/TGFB signaling in MDS and AML MSCs, while B-ALL, B-NHL, and the MPN group exhibit an increase and notable number of differentially expressed genes related to SMAD independent MAPK-signaling. (D) Representative pictures of MSCs from healthy, myeloid, and lymphoid groups after 14 days of osteogenic differentiation together with SD208. DMSO serves as an internal control. MSCs were induced for osteogenic differentiation and SD208 was added to each medium change within the osteogenic differentiation period. After 14 days of induction, MSCs were stained with Alizarin Red. Scale bars indicating 100 µm are shown.
Figure 8
Figure 8
Graphical overview of representative exclusively differentially expressed genes from our RNA sequencing data in the myeloid and lymphoid group that are clearly assigned to the BMP/TGFB signaling pathway. (A) Illustration of representative and exclusively differentially expressed genes only in the “all myeloid group” (MPN, MDS, AML) and the exclusively overlapping differentially expressed genes only in the “all lymphoid group” (B-ALL, B-NHL) (from Figure 5D, black highlighted genes). Translation of differentially expressed genes from our mRNA sequencing data (FDR q-value < 0.05) from overlapping genes in all myeloid and separately in all lymphoid groups to a correlation and potential protein network of these genes as generated with STRING database (Version 12.0). STRING visualization was adapted starting from TGFB1 as is highlighted with a circle. In the “all myeloid group”, 52 out of 192 exclusively differentially expressed genes in this group clearly show a direct correlation to the TGFB-signaling cascade based on current data in STRING (Version 12.0) (B, left side). In the “all lymphoid group”, 26 out of 123 exclusively differentially expressed genes in this group clearly show a direct correlation to the TGFB-signaling cascade based on current data in STRING (Version 12.0) (B, right side). Overrepresented genes are red-circled, and underrepresented genes are blue-circled. (B) Graphical overview of further exclusively differentially expressed genes in the respective group, myeloid or lymphoid group (contrasted to healthy) that are regulators or related to the WNT and BMP/TGFB signaling pathways as well as downstream targets of these signaling pathways exclusively in the respective group. (TGFB1*, was significant in p-value 0.005, FDR q-value 0.1, B-ALL sample 2 exhibited a lower Transcript per million (TPM) expression of TGFB1 than all other samples). (C) Illustration of representative and exclusively overlapping differentially expressed genes in the “all myeloid group” and the “all lymphoid group” and the relationship to the canonical and non-canonical BMP/TGFB signaling pathway. Illustration of DESeq2 Data (p-adjusted < 0.05) reveals a clear shift to SMAD-dependent BMP/TGFB signaling in MDS and AML MSCs, while B-ALL, B-NHL, and the MPN group exhibit an increase and notable number of differentially expressed genes related to SMAD independent MAPK-signaling. (D) Representative pictures of MSCs from healthy, myeloid, and lymphoid groups after 14 days of osteogenic differentiation together with SD208. DMSO serves as an internal control. MSCs were induced for osteogenic differentiation and SD208 was added to each medium change within the osteogenic differentiation period. After 14 days of induction, MSCs were stained with Alizarin Red. Scale bars indicating 100 µm are shown.

References

    1. Alaggio R., Amador C., Anagnostopoulos I., Attygalle A.D., Araujo I.B.O., Berti E., Bhagat G., Borges A.M., Boyer D., Calaminici M., et al. The 5th edition of the World Health Organization Classification of Haematolymphoid Tumours: Lymphoid Neoplasms. Leukemia. 2022;36:1720–1748. doi: 10.1038/s41375-022-01620-2. - DOI - PMC - PubMed
    1. Arber D.A., Orazi A., Hasserjian R.P., Borowitz M.J., Calvo K.R., Kvasnicka H.M., Wang S.A., Bagg A., Barbui T., Branford S., et al. International Consensus Classification of Myeloid Neoplasms and Acute Leukemias: Integrating morphologic, clinical, and genomic data. Blood. 2022;140:1200–1228. doi: 10.1182/blood.2022015850. - DOI - PMC - PubMed
    1. Will B., Zhou L., Vogler T.O., Ben-Neriah S., Schinke C., Tamari R., Yu Y., Bhagat T.D., Bhattacharyya S., Barreyro L., et al. Stem and progenitor cells in myelodysplastic syndromes show aberrant stage-specific expansion and harbor genetic and epigenetic alterations. Blood. 2012;120:2076–2086. doi: 10.1182/blood-2011-12-399683. - DOI - PMC - PubMed
    1. Weaver C.J., Tariman J.D. Multiple Myeloma Genomics: A Systematic Review. Semin. Oncol. Nurs. 2017;33:237–253. doi: 10.1016/j.soncn.2017.05.001. - DOI - PubMed
    1. Borkhardt A., Wuchter C., Viehmann S., Pils S., Teigler-Schlegel A., Stanulla M., Zimmermann M., Ludwig W.D., Janka-Schaub G., Schrappe M., et al. Infant acute lymphoblastic leukemia—Combined cytogenetic, immunophenotypical and molecular analy-sis of 77 cases. Leukemia. 2002;16:1685–1690. doi: 10.1038/sj.leu.2402595. - DOI - PubMed

Grants and funding