

Identification and Evaluation of Olive Phenolics in the Context of Amine Oxidase Enzyme Inhibition and Depression: In Silico Modelling and In Vitro Validation
- PMID: 38893322
- PMCID: PMC11173677
- DOI: 10.3390/molecules29112446
Identification and Evaluation of Olive Phenolics in the Context of Amine Oxidase Enzyme Inhibition and Depression: In Silico Modelling and In Vitro Validation
Abstract
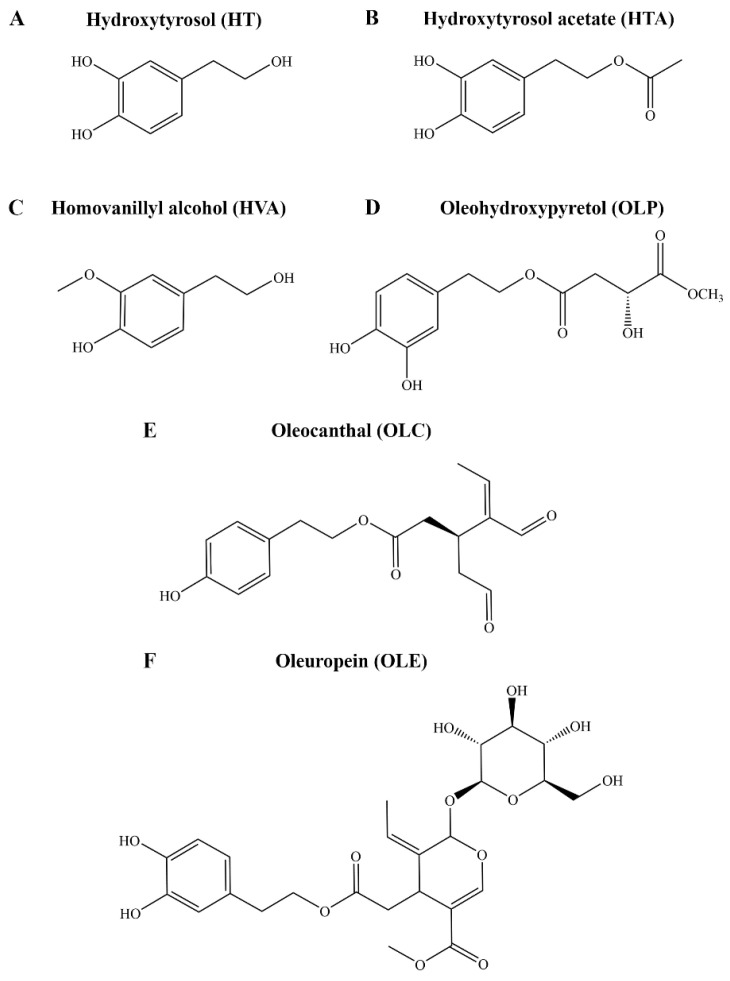
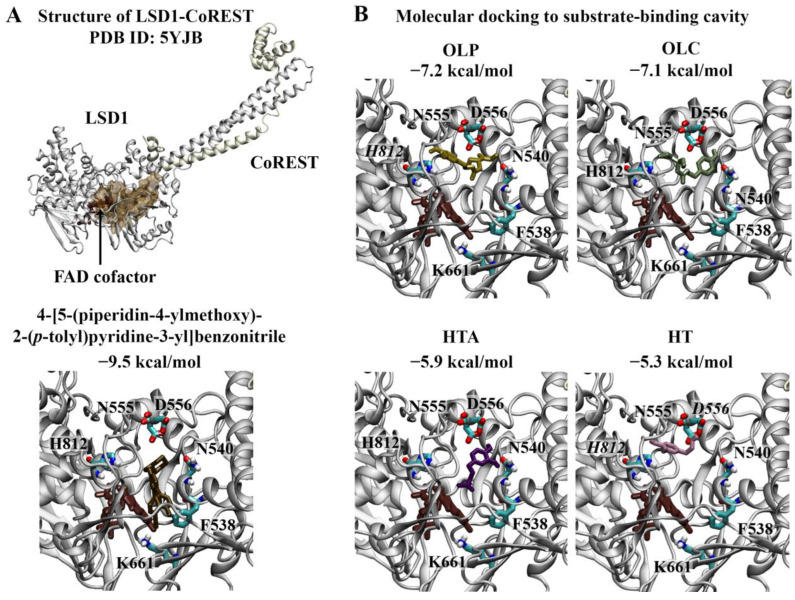
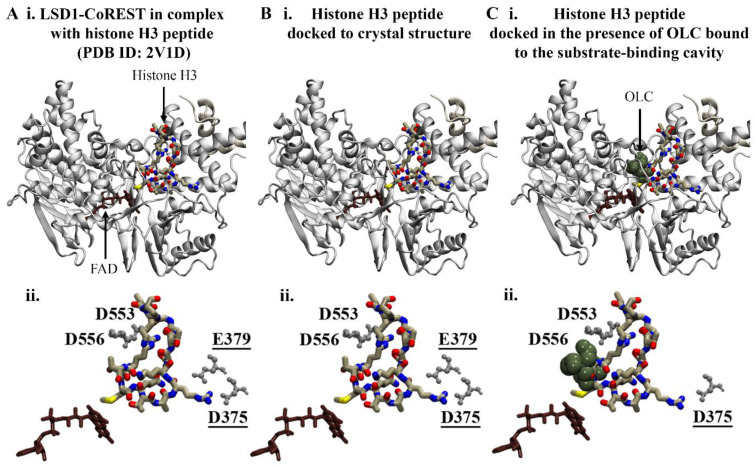
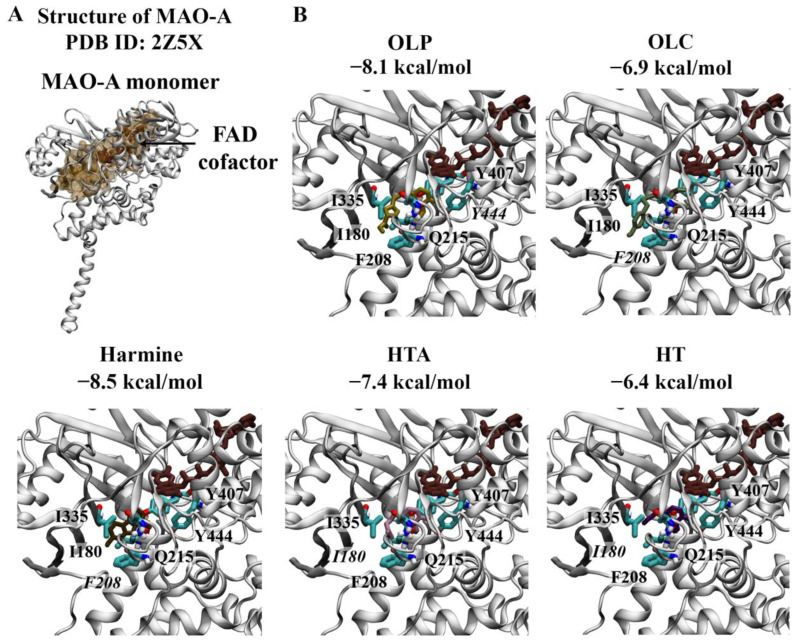
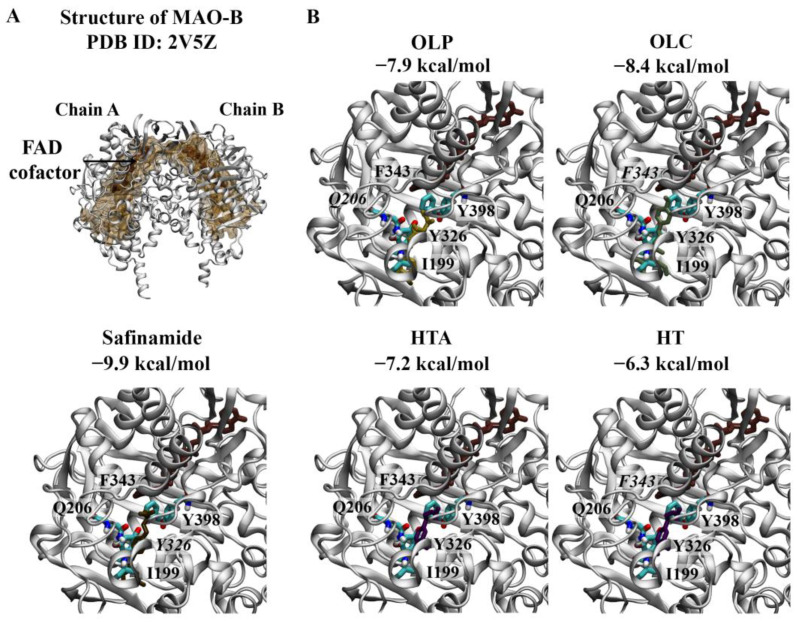
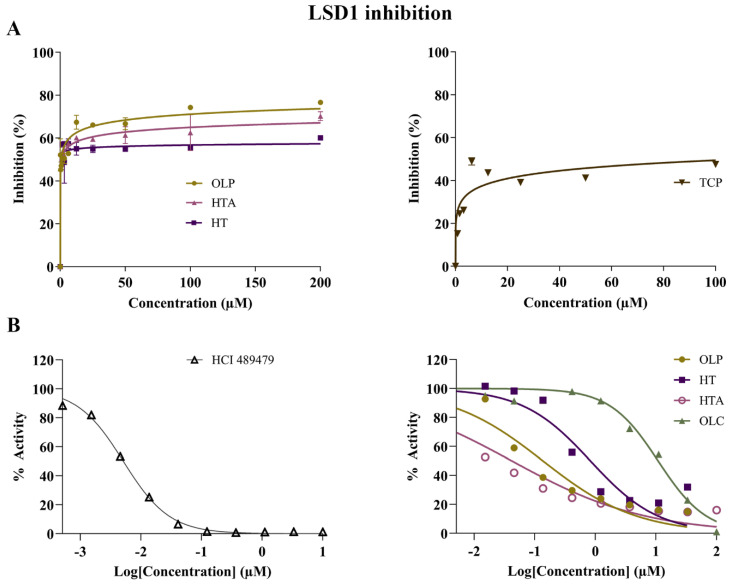
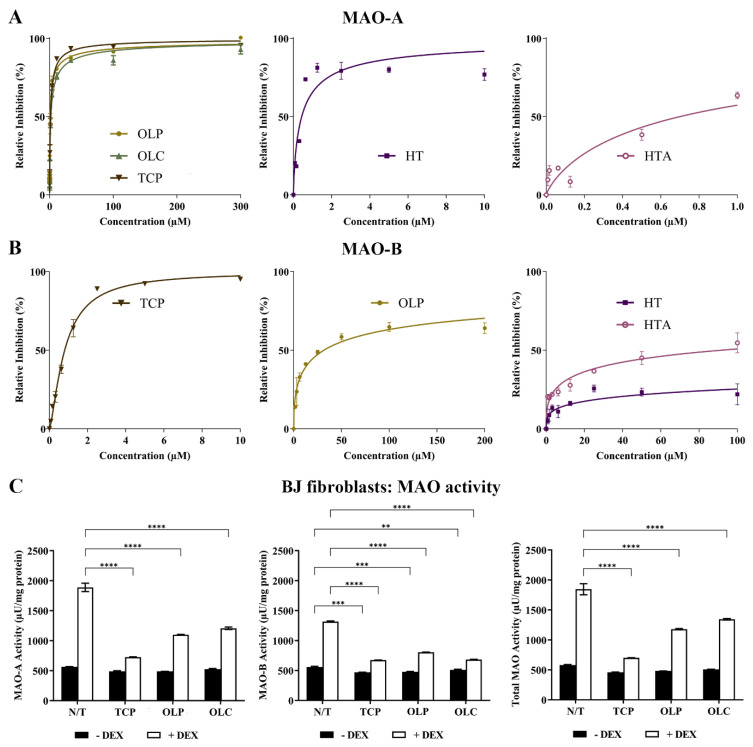
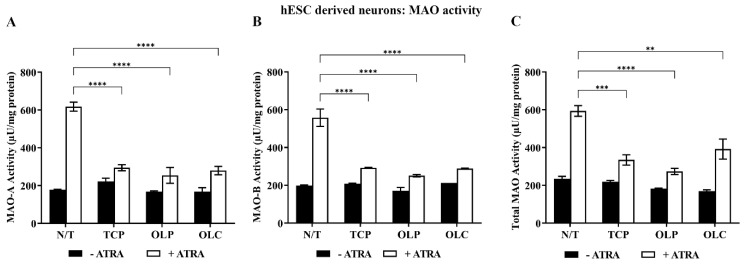
The Mediterranean diet well known for its beneficial health effects, including mood enhancement, is characterised by the relatively high consumption of extra virgin olive oil (EVOO), which is rich in bioactive phenolic compounds. Over 200 phenolic compounds have been associated with Olea europaea, and of these, only a relatively small fraction have been characterised. Utilising the OliveNetTM library, phenolic compounds were investigated as potential inhibitors of the epigenetic modifier lysine-specific demethylase 1 (LSD1). Furthermore, the compounds were screened for inhibition of the structurally similar monoamine oxidases (MAOs) which are directly implicated in the pathophysiology of depression. Molecular docking highlighted that olive phenolics interact with the active site of LSD1 and MAOs. Protein-peptide docking was also performed to evaluate the interaction of the histone H3 peptide with LSD1, in the presence of ligands bound to the substrate-binding cavity. To validate the in silico studies, the inhibitory activity of phenolic compounds was compared to the clinically approved inhibitor tranylcypromine. Our findings indicate that olive phenolics inhibit LSD1 and the MAOs in vitro. Using a cell culture model system with corticosteroid-stimulated human BJ fibroblast cells, the results demonstrate the attenuation of dexamethasone- and hydrocortisone-induced MAO activity by phenolic compounds. The findings were further corroborated using human embryonic stem cell (hESC)-derived neurons stimulated with all-trans retinoic acid. Overall, the results indicate the inhibition of flavin adenine dinucleotide (FAD)-dependent amine oxidases by olive phenolics. More generally, our findings further support at least a partial mechanism accounting for the antidepressant effects associated with EVOO and the Mediterranean diet.
Keywords: Olea europaea; hydroxytyrosol; lysine-specific demethylase 1; monoamine oxidase; oleocanthal; oleohydroxypyretol; olive phenolics.
Conflict of interest statement
Author Erik Goebel was employed by company LLC. The remaining authors declare that the research was conducted in the absence of any commercial or financial relationships that could be construed as a potential conflict of interest.
Figures
Similar articles
-
Investigation of the Anti-Inflammatory Properties of Bioactive Compounds from Olea europaea: In Silico Evaluation of Cyclooxygenase Enzyme Inhibition and Pharmacokinetic Profiling.Molecules. 2024 Jul 26;29(15):3502. doi: 10.3390/molecules29153502. Molecules. 2024. PMID: 39124908 Free PMC article.
-
Extra Virgin Olive Oil Contains a Phenolic Inhibitor of the Histone Demethylase LSD1/KDM1A.Nutrients. 2019 Jul 19;11(7):1656. doi: 10.3390/nu11071656. Nutrients. 2019. PMID: 31331073 Free PMC article.
-
Chromatin modification by olive phenolics: In silico molecular docking studies utilising the phenolic groups categorised in the OliveNet™ database against lysine specific demethylase enzymes.J Mol Graph Model. 2020 Jun;97:107575. doi: 10.1016/j.jmgm.2020.107575. Epub 2020 Feb 26. J Mol Graph Model. 2020. PMID: 32126499
-
Health Effects of Phenolic Compounds Found in Extra-Virgin Olive Oil, By-Products, and Leaf of Olea europaea L.Nutrients. 2019 Aug 1;11(8):1776. doi: 10.3390/nu11081776. Nutrients. 2019. PMID: 31374907 Free PMC article. Review.
-
Epigenetic Modifications Induced by Olive Oil and Its Phenolic Compounds: A Systematic Review.Molecules. 2021 Jan 7;26(2):273. doi: 10.3390/molecules26020273. Molecules. 2021. PMID: 33430487 Free PMC article.
Cited by
-
Global Status, Recent Trends, and Knowledge Mapping of Olive Bioactivity Research Through Bibliometric Analysis (2000-2024).Foods. 2025 Apr 14;14(8):1349. doi: 10.3390/foods14081349. Foods. 2025. PMID: 40282751 Free PMC article. Review.
-
Investigation of the Anti-Inflammatory Properties of Bioactive Compounds from Olea europaea: In Silico Evaluation of Cyclooxygenase Enzyme Inhibition and Pharmacokinetic Profiling.Molecules. 2024 Jul 26;29(15):3502. doi: 10.3390/molecules29153502. Molecules. 2024. PMID: 39124908 Free PMC article.
-
An In Silico Investigation of the Pathogenic G151R G Protein-Gated Inwardly Rectifying K+ Channel 4 Variant to Identify Small Molecule Modulators.Biology (Basel). 2024 Nov 29;13(12):992. doi: 10.3390/biology13120992. Biology (Basel). 2024. PMID: 39765659 Free PMC article.
References
-
- GBD 2019 Mental Disorders Collaborators Global, regional, and national burden of 12 mental disorders in 204 countries and territories, 1990–2019: A systematic analysis for the Global Burden of Disease Study 2019. Lancet Psychiatry. 2022;9:137–150. doi: 10.1016/s2215-0366(21)00395-3. - DOI - PMC - PubMed
-
- Penninx B.W.J.H., Lamers F., Milaneschi Y.S. 03.02—Clinical heterogeneity in major depressive disorder. Eur. Neuropsychopharmacol. 2018;28:S59–S60. doi: 10.1016/j.euroneuro.2017.12.090. - DOI
-
- World Health Organization . International Classification of Diseases for Mortality and Morbidity Statistics (11th Revision) World Health Organization; Geneva, Switzerland: 2018.
-
- Diagnostic and Statistical Manual of Mental Disorders. American Psychiatric Association Publishing; Washington, DC, USA: 2022. Depressive Disorders. - DOI
MeSH terms
Substances
LinkOut - more resources
Full Text Sources
