. 2024 May 25;29(11):2503.
doi: 10.3390/molecules29112503.

Baicalin and Baicalein Enhance Cytotoxicity, Proapoptotic Activity, and Genotoxicity of Doxorubicin and Docetaxel in MCF-7 Breast Cancer Cells

Affiliations

Baicalin and Baicalein Enhance Cytotoxicity, Proapoptotic Activity, and Genotoxicity of Doxorubicin and Docetaxel in MCF-7 Breast Cancer Cells

Joanna Bernasinska-Slomczewska et al. Molecules. .

Abstract

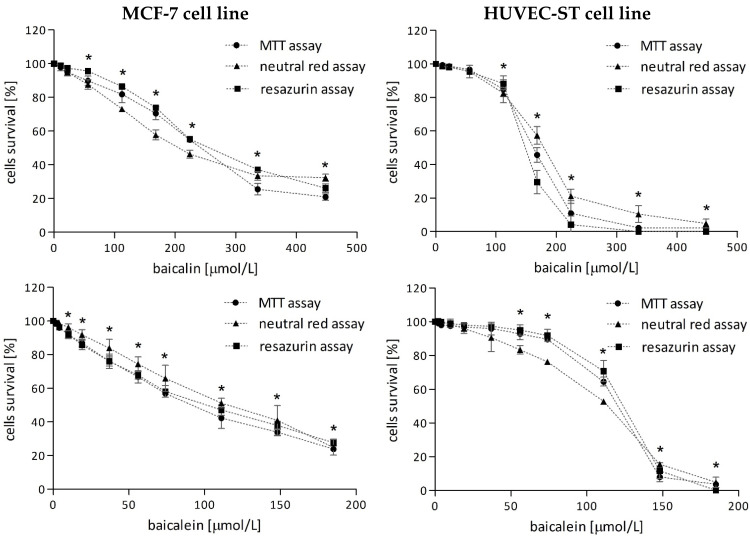
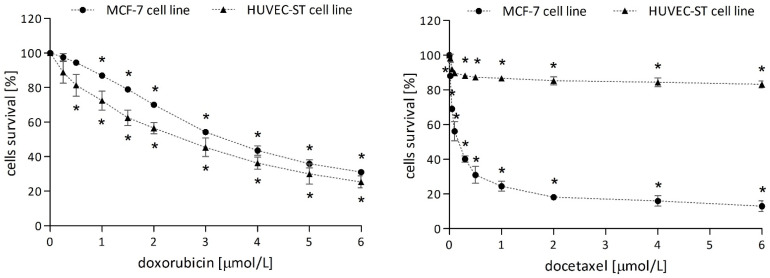
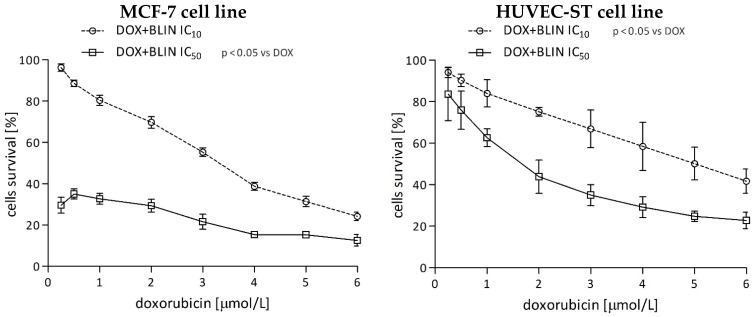
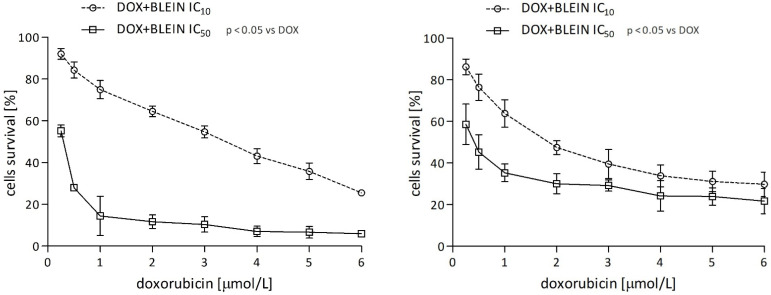
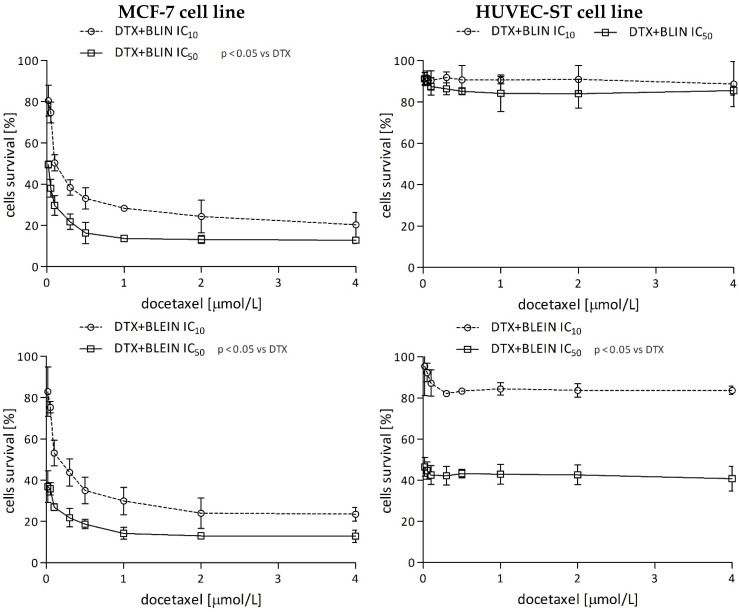
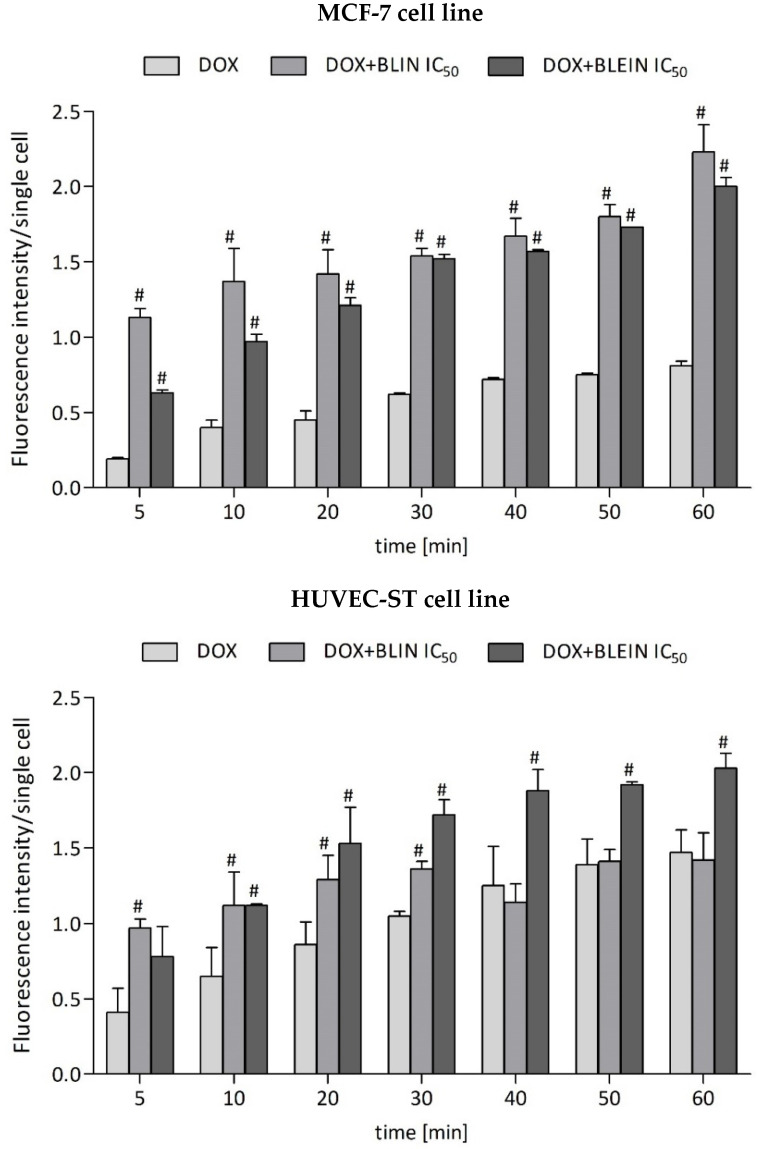
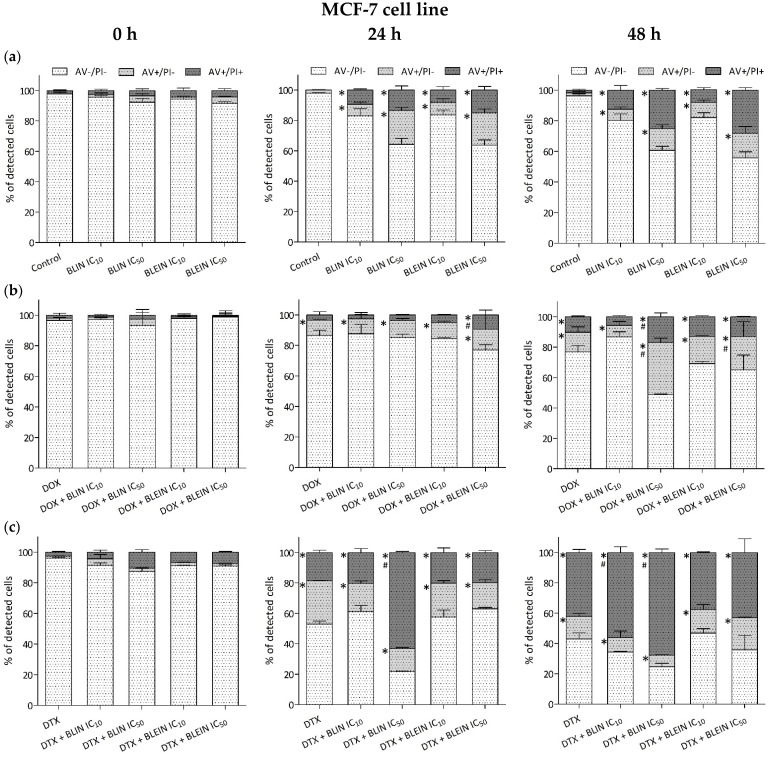
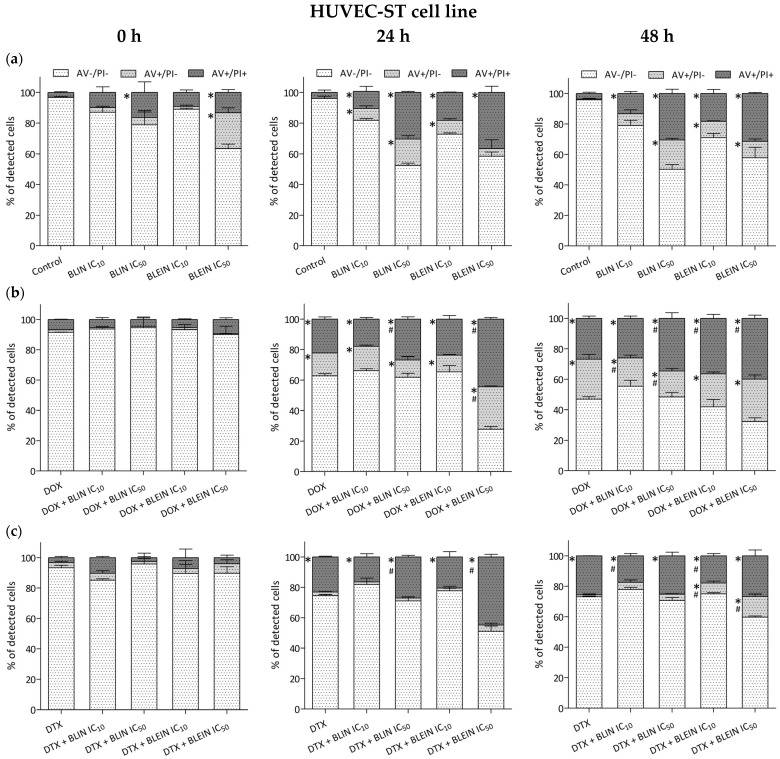
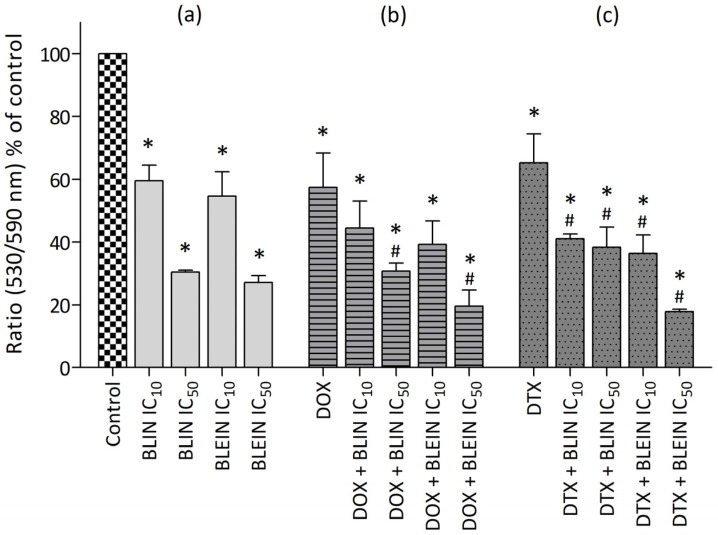
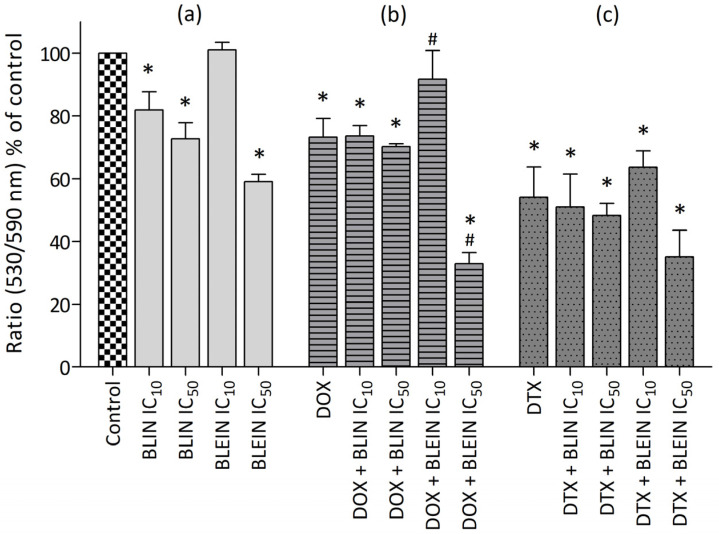
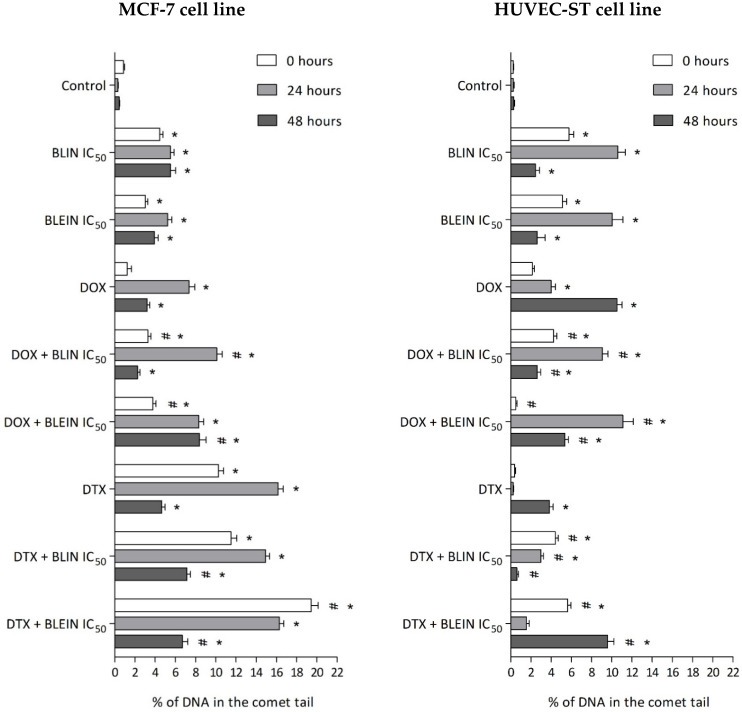
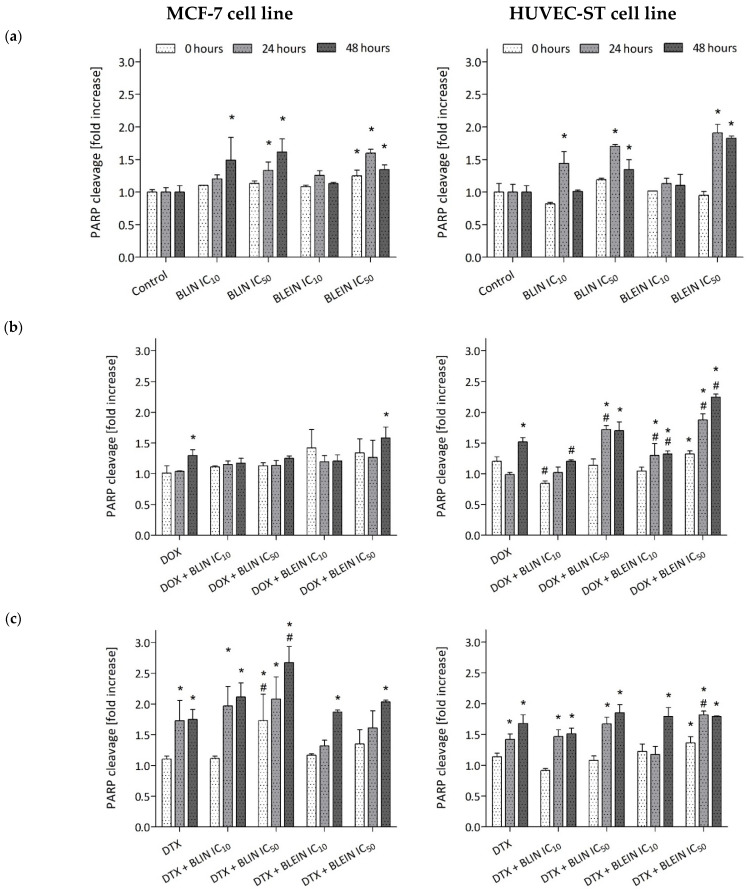
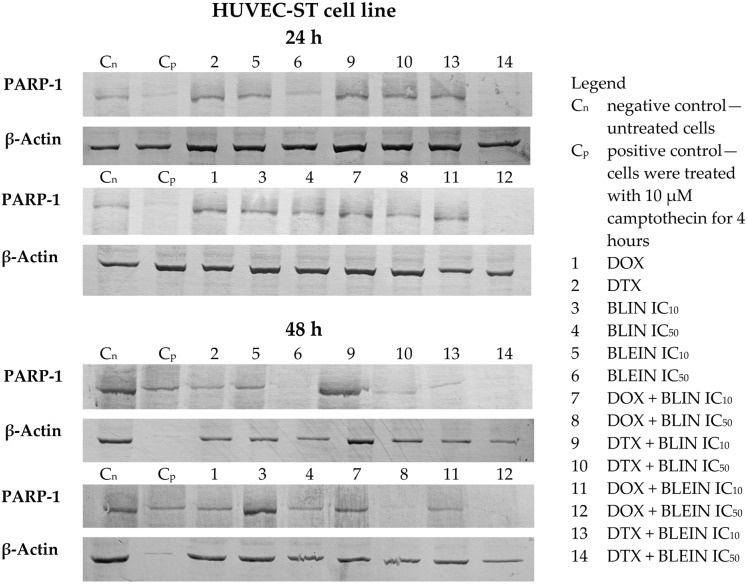
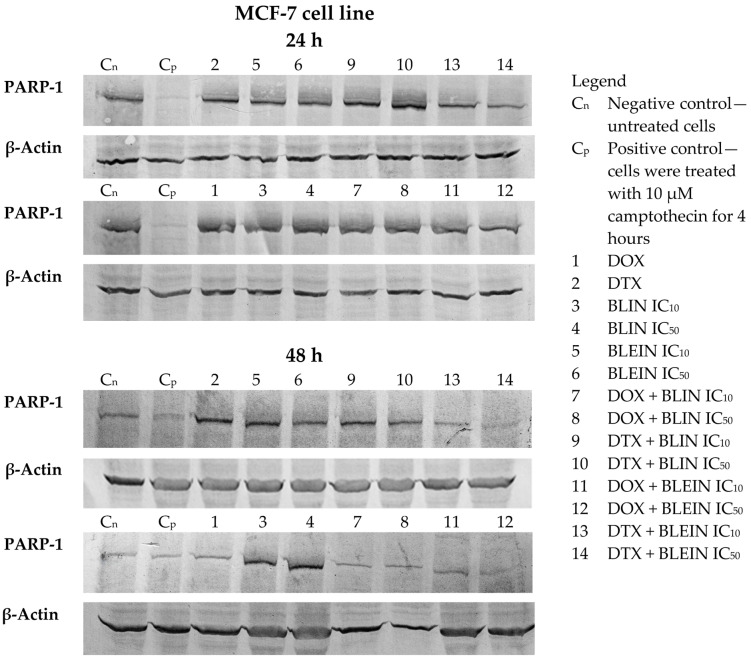
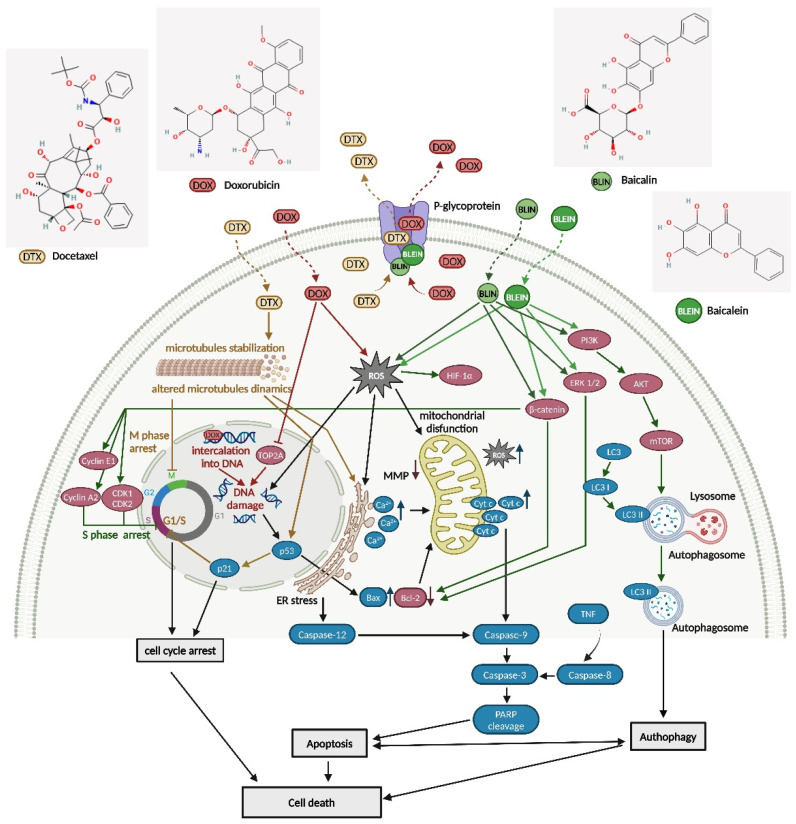
Breast cancer is a major health concern and the leading cause of death among women worldwide. Standard treatment often involves surgery, radiotherapy, and chemotherapy, but these come with side effects and limitations. Researchers are exploring natural compounds like baicalin and baicalein, derived from the Scutellaria baicalensis plant, as potential complementary therapies. This study investigated the effects of baicalin and baicalein on the cytotoxic, proapoptotic, and genotoxic activity of doxorubicin and docetaxel, commonly used chemotherapeutic drugs for breast cancer. The analysis included breast cancer cells (MCF-7) and human endothelial cells (HUVEC-ST), to assess potential effects on healthy tissues. We have found that baicalin and baicalein demonstrated cytotoxicity towards both cell lines, with more potent effects observed in baicalein. Both flavonoids, baicalin (167 µmol/L) and baicalein (95 µmol/L), synergistically enhanced the cytotoxic, proapoptotic, and genotoxic activity of doxorubicin and docetaxel in breast cancer cells. In comparison, their effects on endothelial cells were mixed and depended on concentration and time. The results suggest that baicalin and baicalein might be promising complementary agents to improve the efficacy of doxorubicin and docetaxel anticancer activity. However, further research is needed to validate their safety and efficacy in clinical trials.

Keywords: DNA damage; apoptosis; baicalein; baicalin; cytotoxicity; docetaxel; doxorubicin.


Conflict of interest statement

The authors declare no conflicts of interest.

Figures

Figure 1
Figure 1
Survival curves of MCF-7 (left panel) and HUVEC-ST (right panel) cells after 24h-incubation with increasing concentrations of baicalin and baicalein. Cell viability was measured using MTT, resazurin, and neutral red method. Data are shown as means ± SD from four individual experiments for MCF-7 and HUVEC-ST cells, with each repeated at least six times. * p < 0.05 vs. control.
Figure 2
Figure 2
Survival curves of MCF-7 and HUVEC-ST cells after 2-h incubation with increasing concentrations of doxorubicin or docetaxel. Cell viability was measured by MTT assay. Values are presented as means ± SD from four individual experiments for MCF-7 and HUVEC-ST cells, with each repeated at least six times. * p < 0.05 vs. control.
Figure 3
Figure 3
Survival curves of MCF-7 (left panel) and HUVEC-ST (right panel) cells preincubated for 22 h with IC10 and IC50 concentrations of baicalin or baicalein and then incubated for 2 h with DOX at concentrations 0.25, 0.5, 1, 2, 3, 4, 5, and 6 μmol/L. Cell viability was measured by MTT assay. Values are presented as means ± SD from four individual experiments for MCF-7 and HUVEC-ST cells, with each repeated at least six times. Statistical significance in the legend indicates that the preincubation with IC10 and IC50 concentrations of baicalin or baicalein shifts the basal survival DOX curve.
Figure 3
Figure 3
Survival curves of MCF-7 (left panel) and HUVEC-ST (right panel) cells preincubated for 22 h with IC10 and IC50 concentrations of baicalin or baicalein and then incubated for 2 h with DOX at concentrations 0.25, 0.5, 1, 2, 3, 4, 5, and 6 μmol/L. Cell viability was measured by MTT assay. Values are presented as means ± SD from four individual experiments for MCF-7 and HUVEC-ST cells, with each repeated at least six times. Statistical significance in the legend indicates that the preincubation with IC10 and IC50 concentrations of baicalin or baicalein shifts the basal survival DOX curve.
Figure 4
Figure 4
Survival curves of MCF-7 (left panel) and HUVEC-ST (right panel) cells preincubated for 22 h with IC10 and IC50 concentrations of baicalin or baicalein and then incubated for 2 h with DTX at concentrations 0.02, 0.05, 0.1, 0.3, 0.5, 1, 2, 4 μmol/L. Cell viability was measured by MTT assay. Values are presented as means ± SD from four individual experiments for MCF-7 and HUVEC-ST cells, with each repeated at least six times. Statistical significance in the legend indicates that the preincubation with IC10 and IC50 concentrations of baicalin or baicalein shifts the basal survival DTX curve.
Figure 5
Figure 5
Doxorubicin accumulation in MCF-7 and HUVEC-ST cells after 22 h of incubation with IC50 concentration of BLIN or BLEIN. Values are presented as means ± SD from four individual experiments for MCF-7 and HUVEC-ST cells. Doxorubicin fluorescence intensity was calculated per single cell. # p < 0.05 vs. DOX.
Figure 6
Figure 6
Changes in membrane lipid asymmetry related to induction of apoptosis and necrosis in MCF-7 cells after (a) 24 h incubation with IC10 or IC50 concentration of BLIN or BLEIN, (b) 2 h of incubation with IC50 concentrations of DOX alone or after 22 h of preincubation with IC10 or IC50 concentration of BLIN or BLEIN, and (c) 2 h of incubation with IC50 concentrations of DTX alone or after 22 h of preincubation with IC10 or IC50 concentration of BLIN or BLEIN. The measurements were conducted immediately after incubation and 24 or 48 h later. Values are presented as means ± SD from four individual experiments. * p < 0.05 vs. control, # p < 0.05 vs. drug used alone.
Figure 7
Figure 7
Changes in membrane lipid asymmetry related to induction of apoptosis and necrosis in HUVEC-ST cells after (a) 24 h incubation with IC10 or IC50 concentration of BLIN or BLEIN, (b) 2 h of incubation with IC50 concentrations of DOX alone or after 22 h of preincubation with IC10 or IC50 concentration of BLIN or BLEIN, and (c) 2 h of incubation with IC50 concentrations of DTX alone or after 22 h of preincubation with IC10 or IC50 concentration of BLIN or BLEIN. The measurements were conducted immediately after incubation and 24 or 48 h later. Values are presented as means ± SD from four individual experiments. * p < 0.05 vs. control, # p < 0.05 vs. drug used alone.
Figure 8
Figure 8
Changes in mitochondrial membrane potential in MCF-7 cells after (a) 24 h incubation with IC10 or IC50 concentration of BLIN or BLEIN, (b) 2 h of incubation with IC50 concentrations of DOX alone or after 22 h of preincubation with IC10 or IC50 concentration of BLIN or BLEIN, and (c) 2 h of incubation with IC50 concentrations of DTX alone or after 22 h of preincubation with IC10 or IC50 concentration of BLIN or BLEIN. Data are presented as means ± SD from four individual experiments, with each repeated at least six times. Control cells were arbitrarily taken as 100%. * p < 0.05 vs. control, # p < 0.05 vs. drug used alone.
Figure 9
Figure 9
Changes in mitochondrial membrane potential in HUVEC-ST cells after (a) 24 h incubation with IC10 or IC50 concentration of BLIN or BLEIN, (b) 2 h of incubation with IC50 concentrations of DOX alone or after 22 h of preincubation with IC10 or IC50 concentration of BLIN or BLEIN, and (c) 2 h of incubation with IC50 concentrations of DTX alone or after 22 h of preincubation with IC10 or IC50 concentration of BLIN or BLEIN. Data are presented as means ± SD from four individual experiments, with each repeated at least six times. Control cells were arbitrarily taken as 100%. * p < 0.05 vs. control, # p < 0.05 vs. drug used alone.
Figure 10
Figure 10
The percent of DNA in the comet tail of MCF-7 (left panel) and HUVEC-ST (right panel) cells after 24 h incubation with IC50 concentration of BLIN or BLEIN, 22 h incubation with IC50 concentration of BLIN or BLEIN and subsequently 2 h with IC50 concentrations of DOX, or 22 h incubation with IC50 concentration of BLIN or BLEIN and subsequently 2 h with IC50 concentrations of DTX. The measurements were conducted immediately after incubation and 24 or 48 h later. Data are presented as means ± SD from four individual experiments. * p < 0.05 vs. control, # p < 0.05 vs. drug used alone.
Figure 11
Figure 11
PARP cleavage quantification in MCF-7 (left panel) and HUVEC-ST (right panel) cells after (a) 24 h incubation with IC10 or IC50 concentration of BLIN or BLEIN, (b) 2 h of incubation with IC50 concentrations of DOX alone or after 22 h of preincubation with IC10 or IC50 concentration of BLIN or BLEIN, and (c) 2 h of incubation with IC50 concentrations of DTX alone or after 22 h of preincubation with IC10 or IC50 concentration of BLIN or BLEIN. The measurements were conducted immediately after incubation and 24 or 48 h later. Data are presented as means ± SD from four individual experiments, each repeated at least in five times. * p < 0.05 vs. control, # p < 0.05 vs. drug used alone. Values are presented as a fold increase of the control.
Figure 12
Figure 12
The expression of PARP-1 and β-Actin in HUVEC-ST cells incubated for 24 h with IC10 or IC50 concentration of BLIN or BLEIN alone or in combination with anticancer drugs (doxorubicin or docetaxel). The proteins were separated by SDS-PAGE, and their levels were analyzed by Western blot 24 and 48 h after incubation.
Figure 13
Figure 13
The expression of PARP-1 and β-Actin in MCF-7 cells incubated for 24 h with IC10 or IC50 concentration of BLIN or BLEIN alone or in combination with anticancer drugs (doxorubicin or docetaxel). The proteins were separated by SDS-PAGE, and their levels were analyzed by Western blot 24 and 48 h after incubation.
Figure 14
Figure 14
A schematic diagram illustrating the structures of the investigated molecules and the cellular and molecular targets of anticancer drugs docetaxel and doxorubicin, as well as flavonoids baicalin and baicalein, in association with their anticancer activity. (Boxes in dark pink indicate downregulation of expression and boxes in blue indicate upregulation of expression). Created with BioRender.com.

Similar articles

Cited by

References

    1. Sung H., Ferlay J., Siegel R.L., Laversanne M., Soerjomataram I., Jemal A., Bray F. Global Cancer Statistics 2020: GLOBOCAN Estimates of Incidence and Mortality Worldwide for 36 Cancers in 185 Countries. CA Cancer J. Clin. 2021;71:209–249. doi: 10.3322/caac.21660. - DOI - PubMed
    1. Viale P.H. The American Cancer Society’s Facts & Figures: 2020 Edition. J. Adv. Pract. Oncol. 2020;11:135–136. doi: 10.6004/jadpro.2020.11.2.1. - DOI - PMC - PubMed
    1. Mutebi M., Anderson B.O., Duggan C., Adebamowo C., Agarwal G., Ali Z., Bird P., Bourque J.-M., DeBoer R., Gebrim L.H., et al. Breast cancer treatment: A phased approach to implementation. Cancer. 2020;126((Suppl. S10)):2365–2378. doi: 10.1002/cncr.32910. - DOI - PubMed
    1. Back N., Cohen I.R., Lajtha A., Lambris J.D., Paoletti R., Yu D., Hung M.-C. Breast Cancer Chemosensitivity. Scholars Portal; New York, NY, USA: 2007.
    1. Lown J.W. Anthracycline and anthraquinone anticancer agents: Current status and recent developments. Pharmacol. Ther. 1993;60:185–214. doi: 10.1016/0163-7258(93)90006-y. - DOI - PubMed