. 2024 May 26;29(11):2509.
doi: 10.3390/molecules29112509.

Effect of Cap Management Frequency on the Phenolic, Chromatic, and Sensory Composition of Cabernet Sauvignon Wines from the Central Coast of California over Two Vintages

Affiliations

Effect of Cap Management Frequency on the Phenolic, Chromatic, and Sensory Composition of Cabernet Sauvignon Wines from the Central Coast of California over Two Vintages

L Federico Casassa et al. Molecules. .

Abstract

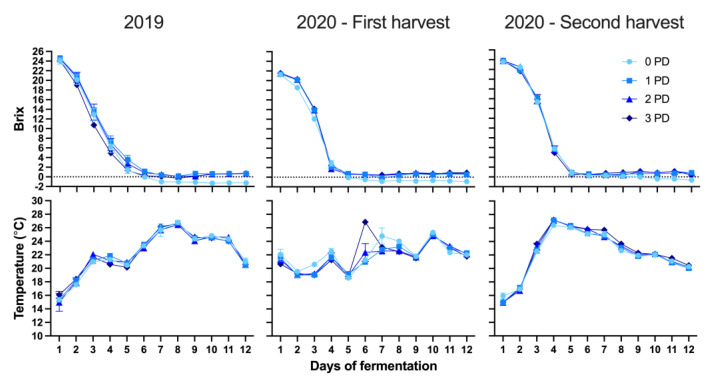
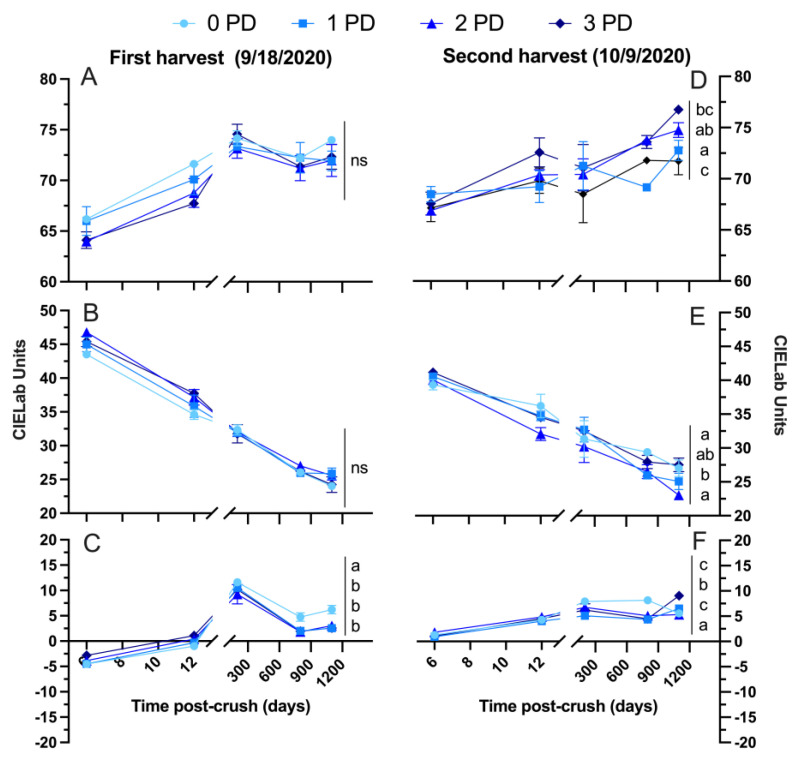
Cabernet Sauvignon from the California Paso Robles AVA was processed with a contrasting array of cap management frequencies, consisting of punch-down (PD) frequencies (0, 1, 2, and 3 PD/day) over two vintages, one of which the fruit was harvested at two contrasting maturity levels. Wines followed with up to 3 years of bottle aging for basic and phenolic chemistry, and the wines of the second harvest of 2020 were submitted to sensory analysis. There were almost non-existent effects due to the frequency of punch downs on parameters such as ethanol, pH, titratable acidity, lactic acid, and glucose + fructose. In 2019, the chromatic differences between different PD regimes were subtle, and minor effects of the punch-down frequency were observed for tannins and total phenolics. During the early stages of alcoholic fermentation, higher levels of all anthocyanin classes were observed in 1 PD wines and the lowest levels in 0 PD wines. The anthocyanin content of the wines of the first harvest (unripe) was 27% higher than that of the wines of the second harvest (ripe), but these differences disappeared after 3 years of bottle aging irrespective of the vintage and harvest date. Acylated anthocyanins were preferentially lost during aging, especially in 2019 wines and, to a lesser extent, in 2020 wines. In 2020, the polymeric pigment content of the wines of the second harvest was higher than in the wines of the first harvest, with 3 PD wines showing higher polymeric pigments and yellow hues than 0 and 2 PD wines after 3 years of bottle aging. Sensory analysis of the second harvest of the 2020 wines showed that the wines of all four PD regimes were perceived as drying, signifying they were perceived as equally astringent, which is consistent with comparable tannin levels on said wines. The perception of bitterness increased with the frequency of punch downs; thus, 3 PD wines showed the highest bitterness perception. It was concluded that in sufficiently warm fermentations and small volumes, phenolic extraction occurs regardless of fruit maturity and under conditions of minimum mixing.

Keywords: Cabernet Sauvignon; cap management; phenolic compounds; sensory analysis.


Conflict of interest statement

The authors declare no conflicts of interest.

Figures

Figure 1
Figure 1
Evolution of the sugar consumption measured as Brix (top panel) and temperature (bottom panel) during the alcoholic fermentation in Cabernet Sauvignon wines fermented with different cap management (punch-down) frequencies over two consecutive vintages. Each data point represents the average of three tank replicates (n = 3).
Figure 2
Figure 2
Concentrations at Day 12 post-crushing (pressing) and at Day 1100 post-crush (3 years after crushing) of (A) anthocyanins; (B) tannins; (C) total phenolics; (D) small polymeric pigments; (E) large polymeric pigments; and (F) total polymeric pigments in Cabernet Sauvignon wines fermented with different cap management (punch-down) frequencies. The wines were of 2019 vintage. Different letters within the same time point indicate significant differences between the treatments as established by Fisher’s LSD, with a significance level of p < 0.05. ns: not significant. Error bars indicate the standard error of the mean (n = 3).
Figure 3
Figure 3
Chromatic composition of the wines at Day 12 post-crushing (pressing) and at Day 1100 post-crush (3 years after crushing) of (A) lightness; (B) a* (red color when positive); and (C) b* (yellow color when positive) in Cabernet Sauvignon wines fermented with different cap management (punch-down) frequencies. Top panel shows the full visible spectrum scans (between 300 to 750 nm) of the wines at Day 12 and 1100 post-crush. The wines were of 2019 vintage. Different letters within the same time point indicate significant differences between the treatments as established by Fisher’s LSD, with a significance level of p < 0.05. ns: not significant. Error bars indicate the standard error of the mean (n = 3).
Figure 4
Figure 4
Evolution during the winemaking and bottle aging of monoglucosylated and acylated anthocyanin derivatives, vitisins, and polymeric pigments in Cabernet Sauvignon wines fermented with different cap management (punch-down) frequencies. The wines were of 2019 vintage. Error bars indicate the standard error of the mean (n = 3).
Figure 5
Figure 5
Evolution during the winemaking and up to 1100 days post-crushing (3 years) of (A,D) anthocyanins; (B,E) tannins; and (C,F) total phenolics in the Cabernet Sauvignon wines harvested at two maturity levels (first and second harvest) and fermented with different cap management (punch-down) frequencies. The wines were of 2020 vintage. Different letters at Day 1100 post-crush indicate significant differences between the treatments as established by Fisher’s LSD, with a significance level of p < 0.05. ns: not significant. Error bars indicate the standard error of the mean (n = 3).
Figure 6
Figure 6
Evolution of the polymeric pigment content of the wines during winemaking and up to 1100 days post-crushing (3 years) of (A,D) small polymeric pigments; (B,E) large polymeric pigments; and (C,F) total polymeric pigments, in Cabernet Sauvignon wines harvested at two maturity levels (first and second harvest) and fermented with different cap management (punch-down) frequencies. The wines were of 2020 vintage. Different letters at Day 1100 post-crush indicate significant differences between the treatments as established by Fisher’s LSD, with a significance level of p < 0.05. ns: not significant. Error bars indicate the standard error of the mean (n = 3).
Figure 7
Figure 7
Evolution of the chromatic composition of the wines during winemaking and up to 1100 days post-crushing (3 years) of (A,D) lightness; (B,E) a* (red color when positive); and (C,F) b* (yellow color when positive) in the Cabernet Sauvignon wines harvested at two maturity levels (first and second harvest) and fermented with different cap management (punch-down) frequencies. The wines were of 2020 vintage. Different letters at Day 1100 post-crush indicate significant differences between the treatments as established by Fisher’s LSD, with a significance level of p < 0.05. ns: not significant. Error bars indicate the standard error of the mean (n = 3).
Figure 8
Figure 8
Evolution during the winemaking and bottle aging of monoglucosylated and acylated anthocyanin derivatives, vitisins, and polymeric pigments in the Cabernet Sauvignon wines harvested at two maturity levels and fermented with different cap management (punch-down) frequencies. (A) first harvest, top panel; (B) second harvest, bottom panel. The wines were of 2020 vintage. Error bars indicate the standard error of the mean (n = 3).
Figure 9
Figure 9
Word clouds depicting, by relative size, the frequency of citation of Cabernet Sauvignon wines fermented with different cap management (punch-down) frequencies, as assessed by a trained sensory panel (n = 13): (A) 0 PD; (B) 1 PD; (C) 2 PD; and (D) 3 PD. Second harvest, 2020 vintage.
Figure 10
Figure 10
The proposed mechanism for the dynamics of phenolic extraction in conditions of minimal cap management/physical mixing. (A) The initial stage of cap formation at relatively low temperatures; (B) convective mixing aided by temperature (T); and (C) cap compaction due to upward (red arrow, P) (CO2) and downward (atmospheric) pressure (red arrow, P), coupled with convective mixing aided by temperature.

Similar articles

Cited by

References

    1. Setford P.C., Jeffery D.W., Grbin P.R., Muhlack R.A. Factors Affecting Extraction and Evolution of Phenolic Compounds During Red Wine Maceration and the Role of Process Modelling. Trends Food Sci. Technol. 2017;69:106–117. doi: 10.1016/j.tifs.2017.09.005. - DOI
    1. Yilmaztekin M., Kocabey N., Hayaloglu A.A. Effect of Maceration Time on Free and Bound Volatiles of Red Wines from Cv. Karaoğlan (Vitis vinifera L.) Grapes Grown in Arapgir, Turkey. J. Food Sci. 2015;80:C556–C563. doi: 10.1111/1750-3841.12767. - DOI - PubMed
    1. Casassa L.F., Beaver C.W., Mireles M.S., Harbertson J.F. Effect of Extended Maceration and Ethanol Concentration on the Extraction and Evolution of Phenolics, Colour Components and Sensory Attributes of Merlot Wines. Aust. J. Grape Wine Res. 2013;19:25–39. doi: 10.1111/ajgw.12009. - DOI
    1. He F., Liang N.-N., Mu L., Pan Q.-H., Wang J., Reeves M.J., Duan C.-Q. Anthocyanins and Their Variation in Red Wines I. Monomeric Anthocyanins and Their Color Expression. Molecules. 2012;17:1571–1601. doi: 10.3390/molecules17021571. - DOI - PMC - PubMed
    1. Medina-Plaza C., Beaver J.W., Lerno L., Dokoozlian N., Ponangi R., Blair T., Block D.E., Oberholster A. Impact of Temperature, Ethanol and Cell Wall Material Composition on Cell Wall-Anthocyanin Interactions. Molecules. 2019;24:3350. doi: 10.3390/molecules24183350. - DOI - PMC - PubMed

LinkOut - more resources