

Improving the Generalizability and Performance of an Ultrasound Deep Learning Model Using Limited Multicenter Data for Lung Sliding Artifact Identification
- PMID: 38893608
- PMCID: PMC11172006
- DOI: 10.3390/diagnostics14111081
Improving the Generalizability and Performance of an Ultrasound Deep Learning Model Using Limited Multicenter Data for Lung Sliding Artifact Identification
Abstract
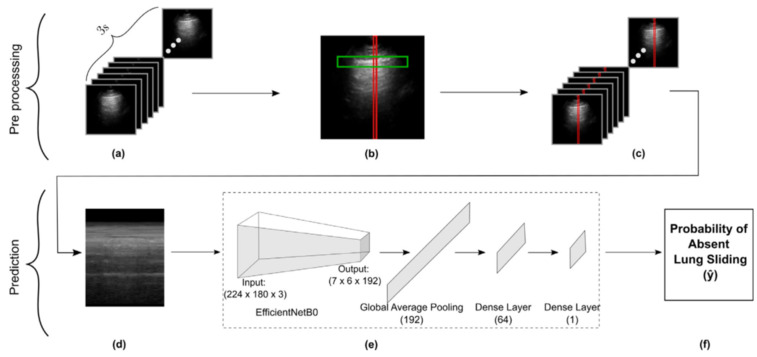
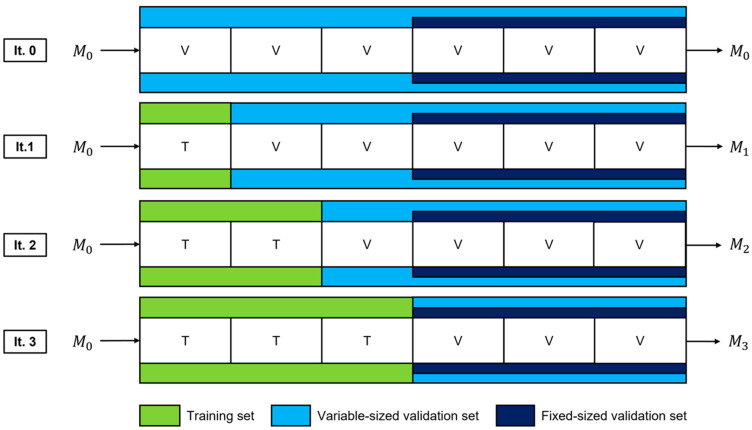
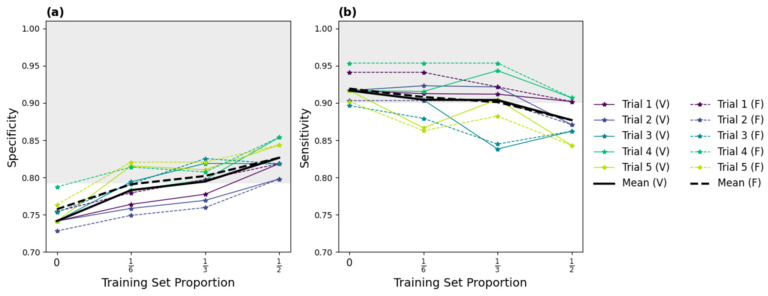
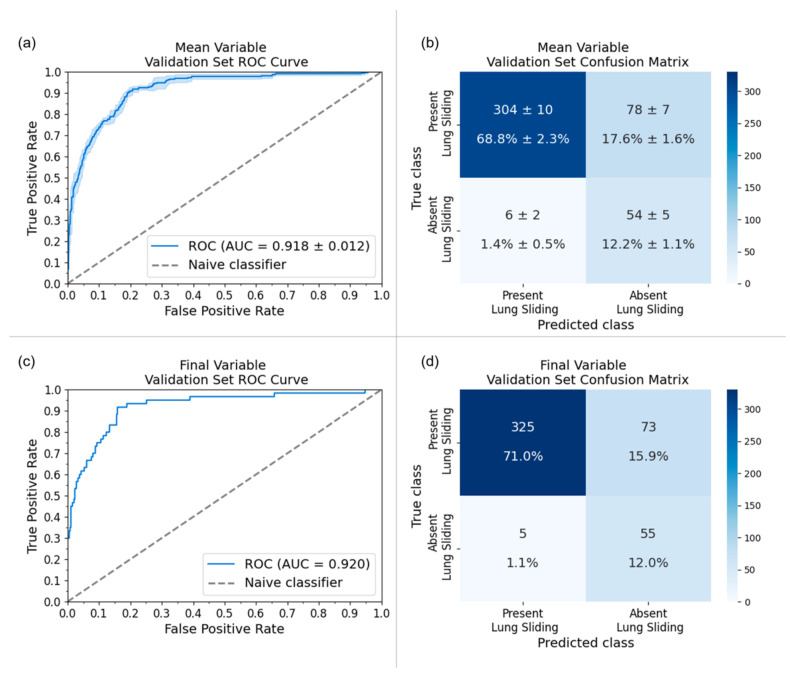
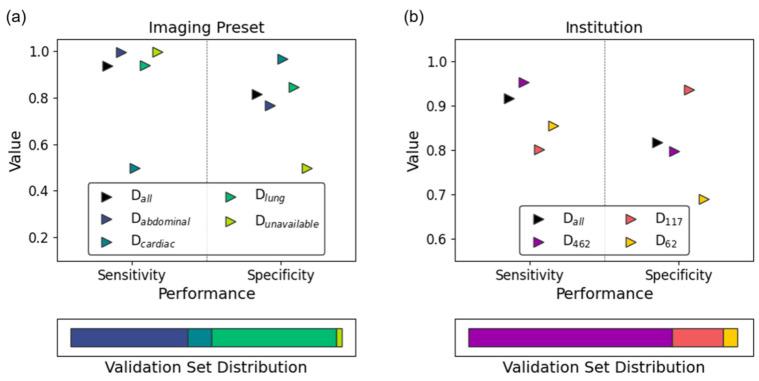
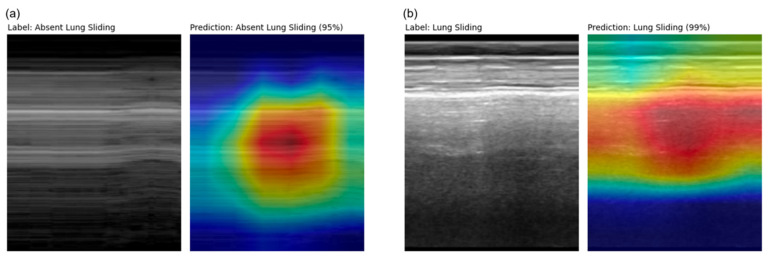
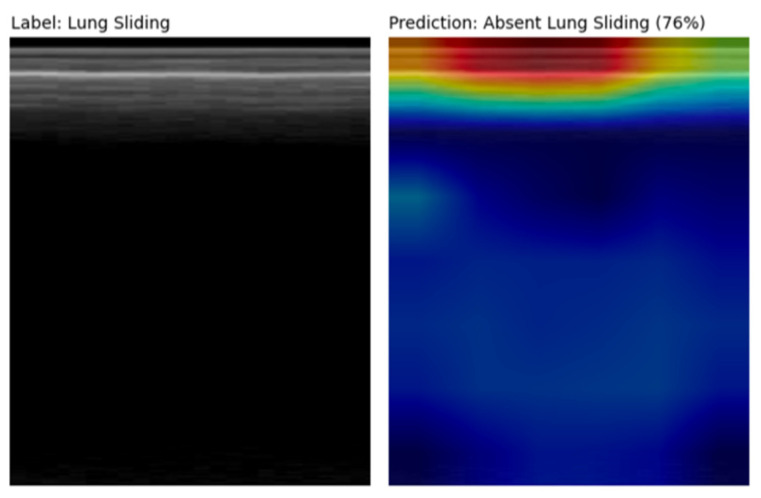
Deep learning (DL) models for medical image classification frequently struggle to generalize to data from outside institutions. Additional clinical data are also rarely collected to comprehensively assess and understand model performance amongst subgroups. Following the development of a single-center model to identify the lung sliding artifact on lung ultrasound (LUS), we pursued a validation strategy using external LUS data. As annotated LUS data are relatively scarce-compared to other medical imaging data-we adopted a novel technique to optimize the use of limited external data to improve model generalizability. Externally acquired LUS data from three tertiary care centers, totaling 641 clips from 238 patients, were used to assess the baseline generalizability of our lung sliding model. We then employed our novel Threshold-Aware Accumulative Fine-Tuning (TAAFT) method to fine-tune the baseline model and determine the minimum amount of data required to achieve predefined performance goals. A subgroup analysis was also performed and Grad-CAM++ explanations were examined. The final model was fine-tuned on one-third of the external dataset to achieve 0.917 sensitivity, 0.817 specificity, and 0.920 area under the receiver operator characteristic curve (AUC) on the external validation dataset, exceeding our predefined performance goals. Subgroup analyses identified LUS characteristics that most greatly challenged the model's performance. Grad-CAM++ saliency maps highlighted clinically relevant regions on M-mode images. We report a multicenter study that exploits limited available external data to improve the generalizability and performance of our lung sliding model while identifying poorly performing subgroups to inform future iterative improvements. This approach may contribute to efficiencies for DL researchers working with smaller quantities of external validation data.
Keywords: POCUS; artificial intelligence; deep learning; explainability; generalizability; lung sliding; lung ultrasound; multicenter; pneumothorax; ultrasound.
Conflict of interest statement
The authors declare no conflict of interest.
Figures
Similar articles
-
Accurate assessment of the lung sliding artefact on lung ultrasonography using a deep learning approach.Comput Biol Med. 2022 Sep;148:105953. doi: 10.1016/j.compbiomed.2022.105953. Epub 2022 Aug 9. Comput Biol Med. 2022. PMID: 35985186
-
Automated Real-Time Detection of Lung Sliding Using Artificial Intelligence: A Prospective Diagnostic Accuracy Study.Chest. 2024 Aug;166(2):362-370. doi: 10.1016/j.chest.2024.02.011. Epub 2024 Feb 15. Chest. 2024. PMID: 38365174
-
Automation of Lung Ultrasound Interpretation via Deep Learning for the Classification of Normal versus Abnormal Lung Parenchyma: A Multicenter Study.Diagnostics (Basel). 2021 Nov 4;11(11):2049. doi: 10.3390/diagnostics11112049. Diagnostics (Basel). 2021. PMID: 34829396 Free PMC article.
-
Pretherapeutic evaluation of patients with upper gastrointestinal tract cancer using endoscopic and laparoscopic ultrasonography.Dan Med J. 2012 Dec;59(12):B4568. Dan Med J. 2012. PMID: 23290296 Review.
-
Evaluation.2024 Mar 5. In: Simon GJ, Aliferis C, editors. Artificial Intelligence and Machine Learning in Health Care and Medical Sciences: Best Practices and Pitfalls [Internet]. Cham (CH): Springer; 2024. 2024 Mar 5. In: Simon GJ, Aliferis C, editors. Artificial Intelligence and Machine Learning in Health Care and Medical Sciences: Best Practices and Pitfalls [Internet]. Cham (CH): Springer; 2024. PMID: 39836860 Free Books & Documents. Review.
Cited by
-
Automated Analysis of Ultrasound for the Diagnosis of Pneumothorax: A Systematic Review.Cureus. 2024 Nov 2;16(11):e72896. doi: 10.7759/cureus.72896. eCollection 2024 Nov. Cureus. 2024. PMID: 39618742 Free PMC article. Review.
-
Progress in the Application of Artificial Intelligence in Ultrasound-Assisted Medical Diagnosis.Bioengineering (Basel). 2025 Mar 13;12(3):288. doi: 10.3390/bioengineering12030288. Bioengineering (Basel). 2025. PMID: 40150752 Free PMC article. Review.
References
-
- Kim J., Hong J., Park H. Prospects of deep learning for medical imaging. Precis. Future Med. 2018;2:37–52. doi: 10.23838/pfm.2018.00030. - DOI
-
- Duran-Lopez L., Dominguez-Morales J.P., Corral-Jaime J., Diaz S.V., Linares-Barranco A. Covid-xnet: A custom deep learning system to diagnose and locate COVID-19 in chest x-ray images. Appl. Sci. 2020;10:5683. doi: 10.3390/app10165683. - DOI
LinkOut - more resources
Full Text Sources
Research Materials
