

Difference in Correction Power between Hybrid Lateral Closed-Wedge High Tibial Osteotomy and Medial Open-Wedge High Tibial Osteotomy was Associated with Severity of Varus Deformity and Different Hinge Distance from Center of Deformity
- PMID: 38893663
- PMCID: PMC11171834
- DOI: 10.3390/diagnostics14111137
Difference in Correction Power between Hybrid Lateral Closed-Wedge High Tibial Osteotomy and Medial Open-Wedge High Tibial Osteotomy was Associated with Severity of Varus Deformity and Different Hinge Distance from Center of Deformity
Abstract
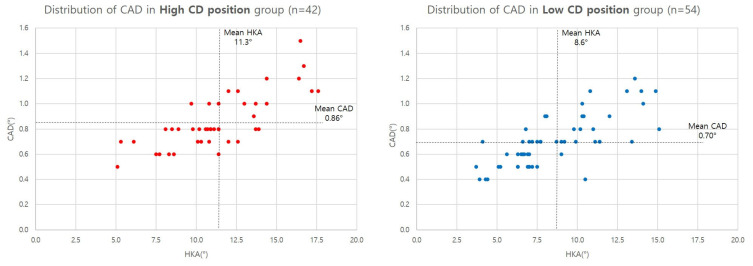
Hybrid lateral closed-wedge high tibial osteotomy (HBHTO) carries certain advantages over medial open-wedge high tibial osteotomy (OWHTO). We investigated the potential difference in the required correction angle between HBHTO and OWHTO to achieve an equal amount of whole lower-extremity alignment correction, retrospectively analyzing the preoperative plain radiographic images of 100 patients. The medial proximal tibial angle (MPTA), joint line convergence angle (JLCA), mechanical lateral distal femoral angle (mLDFA), hip-knee-ankle axis (HKA), length of the tibia, width of the tibial plateau, length of the lower limb (leg length), and location of the center of deformity (CD) were measured. Differences in the required correction angle at the hinge point between the two techniques (CAD) were compared, and correlation analysis was performed to reveal the influential factors. The mean difference in CAD between HBHTO and OWHTO was 0.78 ± 0.22 (0.4~1.5)°, and mean WBL position change per correction angle was 3.9 ± 0.3 (3.0~4.6)% in HBHTO and 4.1 ± 0.3 (3.1~4.7)% in OWHTO. Correlation analysis revealed a strong positive correlation between CAD and HKA. mLDFA, JLCA, MPTA, leg length, OWCD, HBCD, and HCD were also significantly correlated with CAD. HBHTO required a 5.6% larger correction angle at the hinge point to achieve the same amount of alignment correction as OWHTO.
Keywords: knee; osteoarthritis; osteotomy; retrospective study; tibia.
Conflict of interest statement
The authors declare no conflicts of interest.
Figures


References
-
- Hernigou P., Medevielle D., Debeyre J., Goutallier D. Proximal tibial osteotomy for osteoarthritis with varus deformity. A ten to thirteen-year follow-up study. J. Bone Jt. Surg. Am. 1987;69:332–354. - PubMed
-
- Sasaki E., Akimoto H., Iio K., Fujita Y., Saruga T., Kakizaki H., Ishibashi Y. Long-term survival rate of closing wedge high tibial osteotomy with high valgus correction: A 15-year follow-up study. Knee Surg. Sports Traumatol. Arthrosc. 2021;29:3221–3228. doi: 10.1007/s00167-020-06128-9. - DOI - PubMed
-
- Safdari M., Dastjerdi A., Makhmalbaf N., Makhmalbaf M., Makhmalbaf H. Closing-Wedge and Opening-Wedge High Tibial Osteotomy as Successful Treatments of Symptomatic Medial Osteoarthritis of the Knee: A Randomized Controlled Trial. Arch. Bone Jt. Surg. 2023;11:421–428. doi: 10.22038/abjs.2023.68944.3253. - DOI - PMC - PubMed
LinkOut - more resources
Full Text Sources
Miscellaneous
