

Evaluation of EEG Signals by Spectral Peak Methods and Statistical Correlation for Mental State Discrimination Induced by Arithmetic Tasks
- PMID: 38894108
- PMCID: PMC11174818
- DOI: 10.3390/s24113316
Evaluation of EEG Signals by Spectral Peak Methods and Statistical Correlation for Mental State Discrimination Induced by Arithmetic Tasks
Abstract
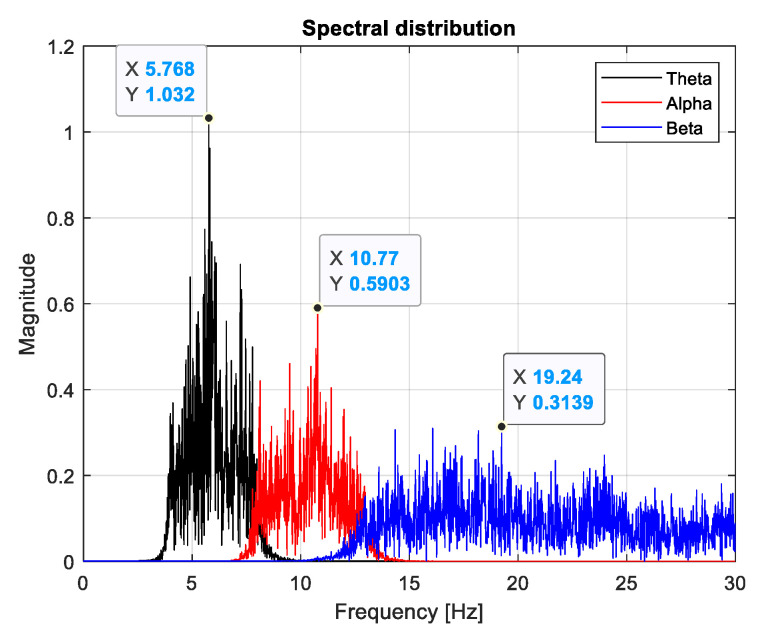
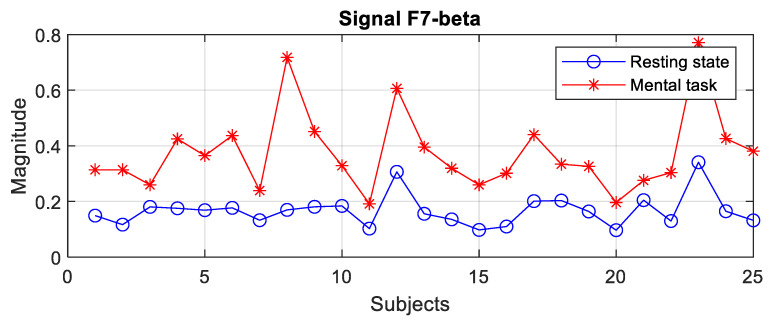
Bringing out brain activity through the interpretation of EEG signals is a challenging problem that involves combined methods of signal analysis. The issue of classifying mental states induced by arithmetic tasks can be solved through various classification methods, using diverse characteristic parameters of EEG signals in the time, frequency, and statistical domains. This paper explores the results of an experiment that aimed to highlight arithmetic mental tasks contained in the PhysioNet database, performed on a group of 36 subjects. The majority of publications on this topic deal with machine learning (ML)-based classification methods with supervised learning support vector machine (SVM) algorithms, K-Nearest Neighbor (KNN), Linear Discriminant Analysis (LDA), and Decision Trees (DTs). Also, there are frequent approaches based on the analysis of EEG data as time series and their classification with Recurrent Neural Networks (RNNs), as well as with improved algorithms such as Long Short-Term Memory (LSTM), Bidirectional Long Short-Term Memory (BLSTM), and Gated Recurrent Units (GRUs). In the present work, we evaluate the classification method based on the comparison of domain limits for two specific characteristics of EEG signals: the statistical correlation of pairs of signals and the size of the spectral peak detected in theta, alpha, and beta bands. This study provides some interpretations regarding the electrical activity of the brain, consolidating and complementing the results of similar research. The classification method used is simple and easy to apply and interpret. The analysis of EEG data showed that the theta and beta frequency bands were the only discriminators between the relaxation and arithmetic calculation states. Notably, the F7 signal, which used the spectral peak criterion, achieved the best classification accuracy (100%) in both theta and beta bands for the subjects with the best results in performing calculations. Also, our study found the Fz signal to be a good sensor in the theta band for mental task discrimination for all subjects in the group with 90% accuracy.
Keywords: EEG signal processing; mental states discrimination; power spectral density; statistical correlation.
Conflict of interest statement
The authors declare no conflicts of interest.
Figures


Similar articles
-
A Comprehensive Machine-Learning-Based Software Pipeline to Classify EEG Signals: A Case Study on PNES vs. Control Subjects.Sensors (Basel). 2020 Feb 24;20(4):1235. doi: 10.3390/s20041235. Sensors (Basel). 2020. PMID: 32102437 Free PMC article.
-
Enhancing EEG-Based Emotion Detection with Hybrid Models: Insights from DEAP Dataset Applications.Sensors (Basel). 2025 Mar 14;25(6):1827. doi: 10.3390/s25061827. Sensors (Basel). 2025. PMID: 40292995 Free PMC article.
-
Machine Learning Approach for Music Familiarity Classification with Single-Channel EEG.Annu Int Conf IEEE Eng Med Biol Soc. 2024 Jul;2024:1-4. doi: 10.1109/EMBC53108.2024.10782402. Annu Int Conf IEEE Eng Med Biol Soc. 2024. PMID: 40039722
-
A Survey of Blind Modulation Classification Techniques for OFDM Signals.Sensors (Basel). 2022 Jan 28;22(3):1020. doi: 10.3390/s22031020. Sensors (Basel). 2022. PMID: 35161766 Free PMC article. Review.
-
A Review on Machine Learning for EEG Signal Processing in Bioengineering.IEEE Rev Biomed Eng. 2021;14:204-218. doi: 10.1109/RBME.2020.2969915. Epub 2021 Jan 22. IEEE Rev Biomed Eng. 2021. PMID: 32011262 Review.
Cited by
-
Narrowband Theta Investigations for Detecting Cognitive Mental Load.Sensors (Basel). 2025 Jun 23;25(13):3902. doi: 10.3390/s25133902. Sensors (Basel). 2025. PMID: 40648159 Free PMC article.
References
-
- Menon V. Arithmetic in the Child and Adult Brain. In: Cohen Kadosh R., Dowker A., editors. The Oxford Handbook of Numerical Cognition. Oxford University Press; Cary, NC, USA: 2015. pp. 503–530.
-
- Fatimah B., Pramanick D., Shivashankaran P. Automatic Detection of Mental Arithmetic Task and Its Difficulty Level Using EEG Signals; Proceedings of the 2020 11th International Conference on Computing, Communication and Networking Technologies (ICCCNT); Kharagpur, India. 1–3 July 2020; New York, NY, USA: IEEE; 2020. pp. 1–6.
-
- Fatimah B., Javali A., Ansar H., Harshitha B.G., Kumar H. Mental Arithmetic Task Classification Using Fourier Decomposition Method; Proceedings of the 2020 International Conference on Communication and Signal Processing (ICCSP); Melmaruvathur, India. 28–30 July 2020; New York, NY, USA: IEEE; 2020. pp. 0046–0050.
-
- Ganguly B., Chatterjee A., Mehdi W., Sharma S., Garai S. EEG Based Mental Arithmetic Task Classification Using a Stacked Long Short Term Memory Network for Brain-Computer Interfacing; Proceedings of the 2020 IEEE VLSI DEVICE CIRCUIT AND SYSTEM (VLSI DCS); Kolkata, India. 18–19 July 2020; New York, NY, USA: IEEE; 2020. pp. 89–94.
MeSH terms
Grants and funding
LinkOut - more resources
Full Text Sources
Miscellaneous
