. 2024 Aug 7;32(8):2741-2761.
doi: 10.1016/j.ymthe.2024.06.023. Epub 2024 Jun 17.

Preclinical efficacy of a HER2 synNotch/CEA-CAR combinatorial immunotherapy against colorectal cancer with HER2 amplification

Affiliations

Preclinical efficacy of a HER2 synNotch/CEA-CAR combinatorial immunotherapy against colorectal cancer with HER2 amplification

Marco Cortese et al. Mol Ther. .

Abstract

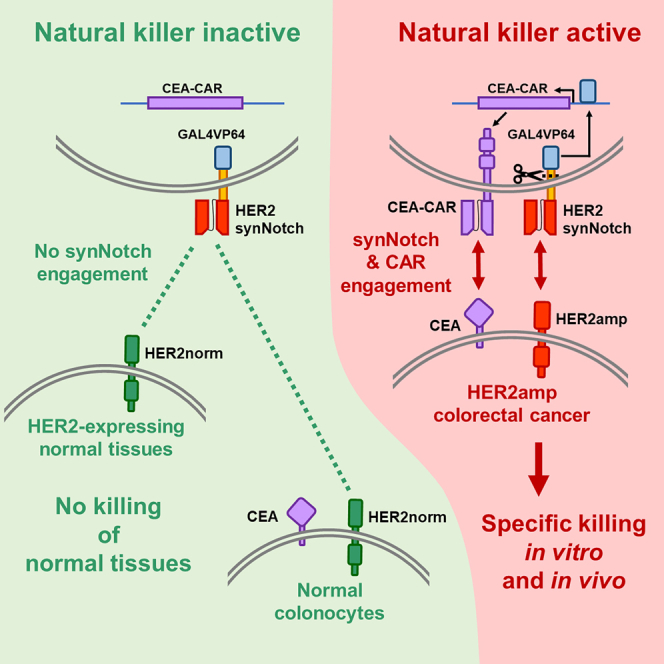
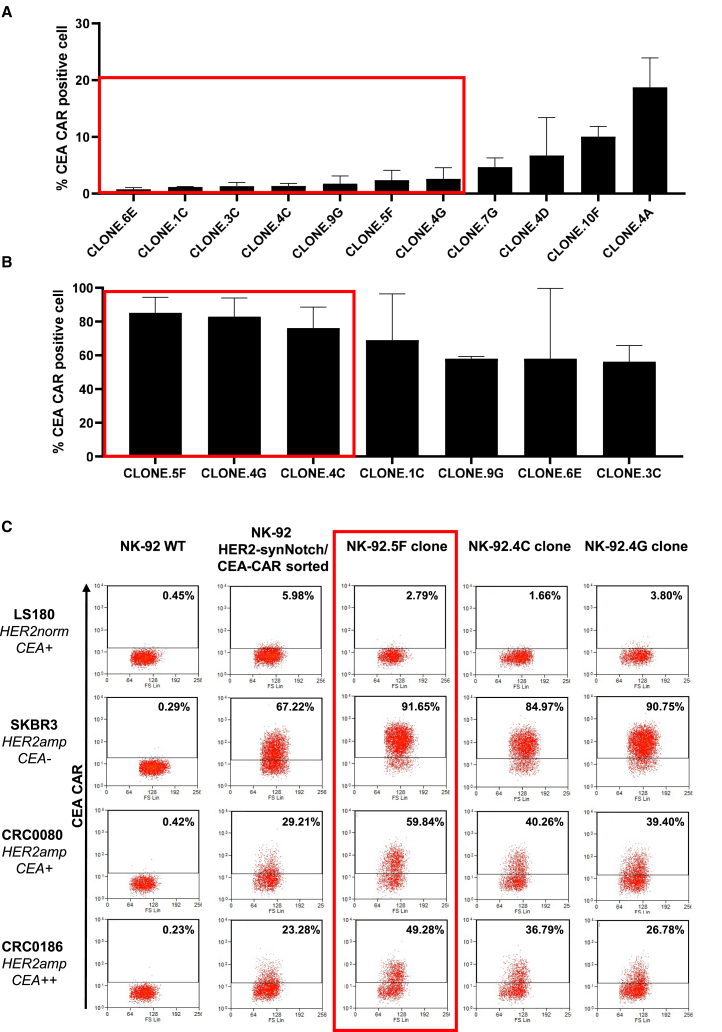
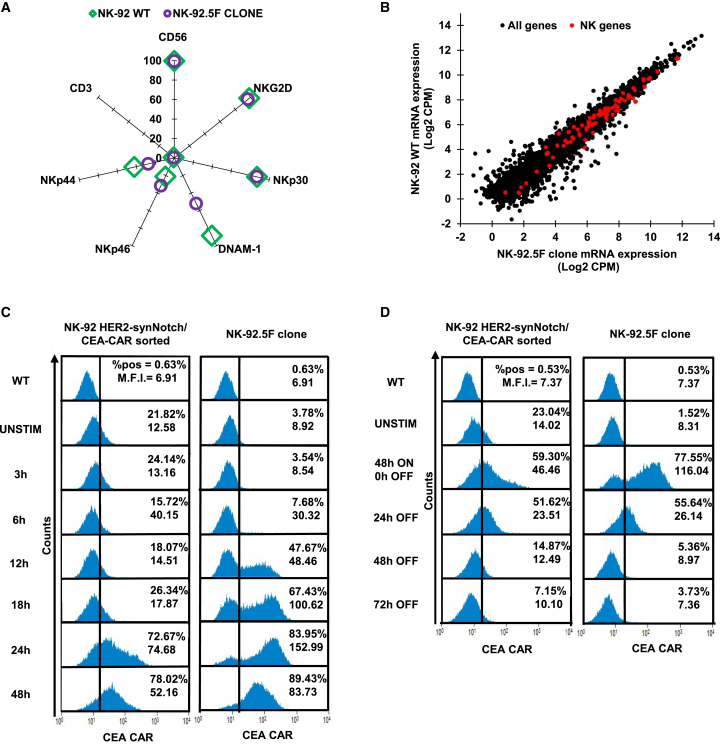
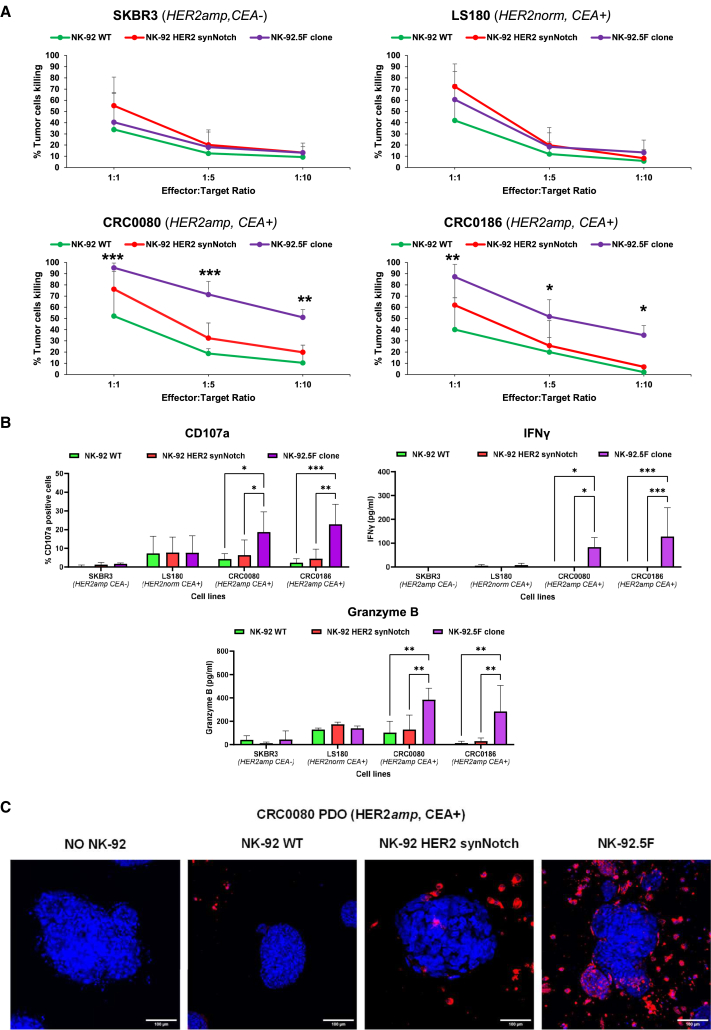
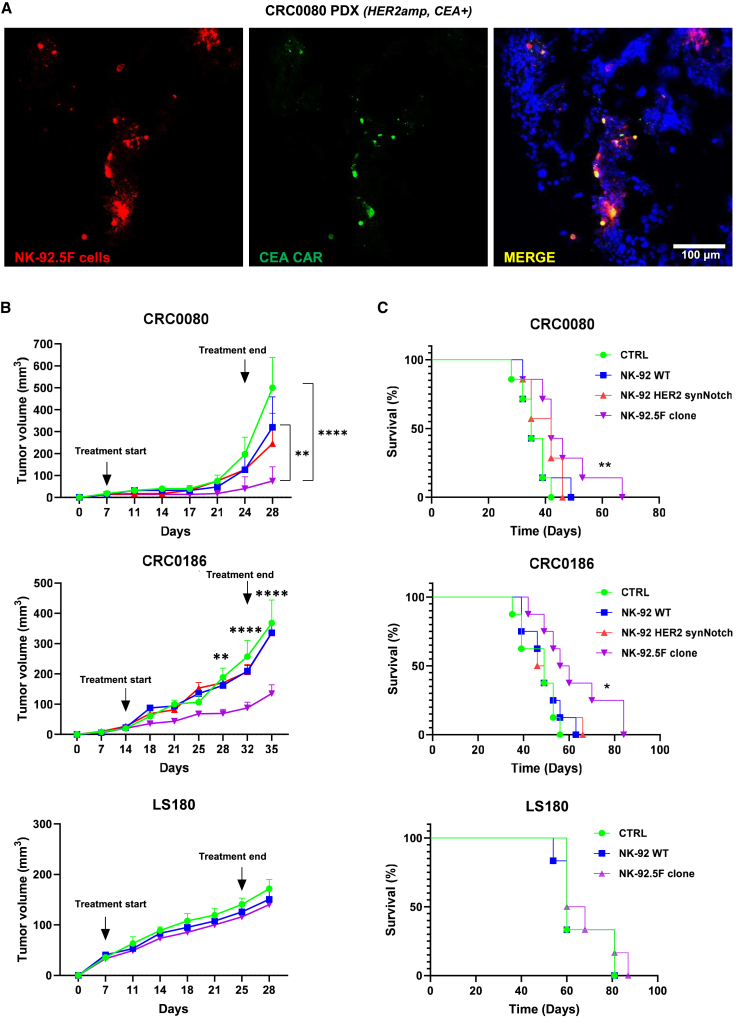
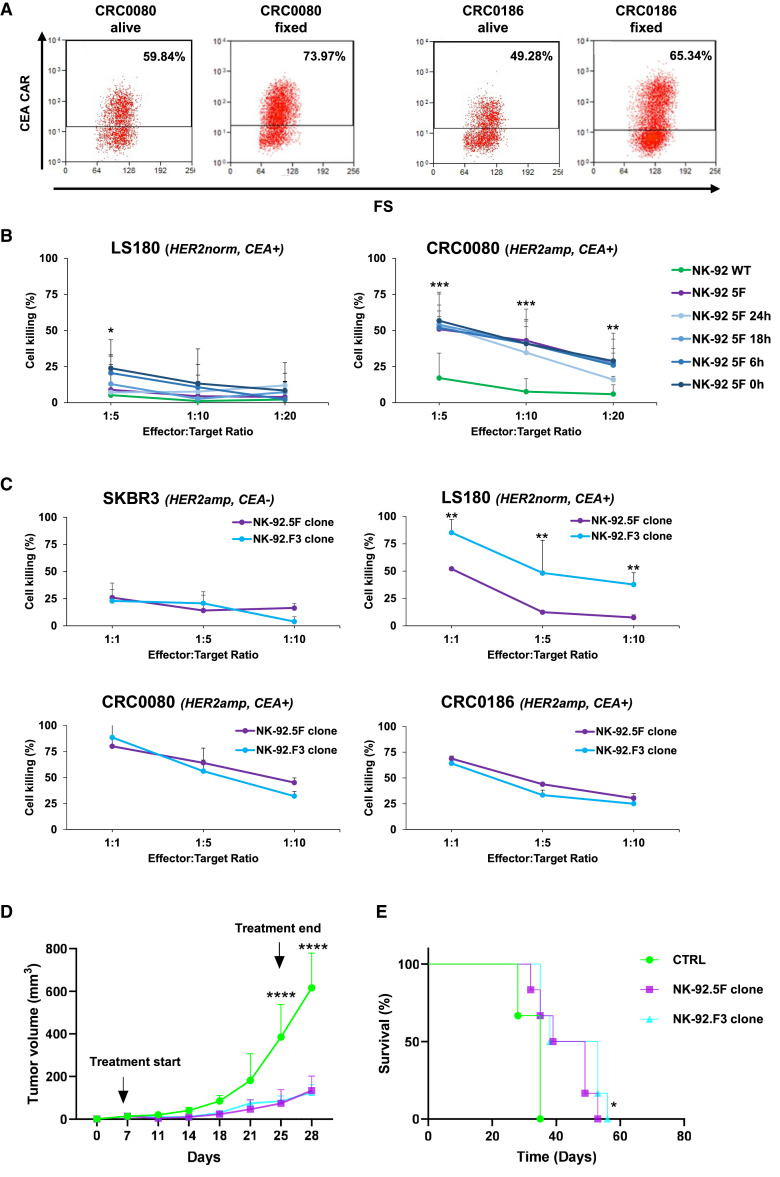
HER2 amplification occurs in approximately 5% of colorectal cancer (CRC) cases and is associated only partially with clinical response to combined human epidermal growth factor receptor 2 (HER2)/epidermal growth factor receptor (EGFR)-targeted treatment. An alternative approach based on adoptive cell therapy using T cells engineered with anti-HER2 chimeric antigen receptor (CAR) proved to be toxic due to on-target/off-tumor activity. Here we describe a combinatorial strategy to safely target HER2 amplification and carcinoembryonic antigen (CEA) expression in CRC using a synNotch-CAR-based artificial regulatory network. The natural killer (NK) cell line NK-92 was engineered with an anti-HER2 synNotch receptor driving the expression of a CAR against CEA only when engaged. After being transduced and sorted for HER2-driven CAR expression, cells were cloned. The clone with optimal performances in terms of specificity and amplitude of CAR induction demonstrated significant activity in vitro and in vivo specifically against HER2-amplified (HER2amp)/CEA+ CRC models, with no effects on cells with physiological HER2 levels. The HER2-synNotch/CEA-CAR-NK system provides an innovative, scalable, and safe off-the-shelf cell therapy approach with potential against HER2amp CRC resistant or partially responsive to HER2/EGFR blockade.

Keywords: CAR; CEA; HER2; NK-92; PDX; colorectal cancer; immunotherapy; synNotch.


Conflict of interest statement

Declaration of interests The authors declare no potential conflict of interest.

Figures

None
Graphical abstract
Figure 1
Figure 1
SynNotch/CAR target expression analysis (A) Bar graphs representing normal tissue mRNA expression data from the Entrez Gene database (Gene: ERBB2, CEACAM5, EPCAM, PROM1, and MUC1). RPKM, reads per kilobase of transcript per million. In the charts, red writing highlight organs in which HER2 mRNA is physiologically expressed at high levels. Notably, only CEA presents selective co-expression with HER2 restricted to the colon. (B) mRNA and protein expression of HER2 (top) and CEA (bottom) in normal tissues from the Human Protein Atlas database (ProteinAtlas: ERBB2 and CEACAM5); the red rectangles highlight mRNA and protein expression of HER2 and CEA in the gastrointestinal tract. (C) Dot plots showing HER2 (x axis) and CEA (y axis) mRNA expression in (left to right): human CRC samples, CRC cell lines, and CRC PDXs. Green boxes highlight HER2amp samples, all expressing high CEA levels. (D) Flow cytometry histograms reporting surface expression of HER2(PE) (left) and CEA(APC) (right) in different cell lines used as models (x axis: log10 expression) (three independent experiments).
Figure 2
Figure 2
CEA-CAR induction in Jurkat cells (A) The HER2 synNotch/CEA-CAR system scheme. (B) Bar graph showing the percentage of CEA-CAR positive cells after co-culture with target cells expressing different levels of HER2, as indicated (basal = without target cells; two independent experiments). (C) Bar graph showing the percentage of CD69 positive cells after co-culture with CRC0080 HER2amp cells (basal = without target cells). Statistical significance was calculated by one-way ANOVA (B) or t test (D). ∗p ≤ 0.05, ∗∗p ≤ 0.01, ∗∗∗p ≤ 0.001). Error bars report standard deviation (two independent experiments).
Figure 3
Figure 3
Workflow for NK-92 transduction, selection, and cloning NK-92 were first transduced with the HER2 synNotch lentiviral vector and sorted twice for constitutive HER2 synNotch expression. Subsequently, cells were transduced with the GAL4-driven CEA-CAR lentiviral vector and sorted to exclude those with basal CEA-CAR expression after co-culture with HER2-normal CRC cells. Finally, cells were co-cultured with HER2amp cells and sorted for positive CEA-CAR expression, to concomitantly generate a sorted population and individual clones. (A) Transduction and sorting workflow. (B) Flow cytometry plots before and after each sorting step, as indicated. Red boxes represent the selected populations. y axis, log10 expression; x axis, forward scatter; %, percent of cell above the depicted positivity threshold; MFI, mean fluorescence intensity.
Figure 4
Figure 4
CEA-CAR expression in the NK-92 sorted population and in the clones (A) Flow cytometry analysis of CEA-CAR basal expression in each clone; the red box indicates clones with the lowest CEA-CAR basal expression, selected for subsequent induction experiments against HER2amp cells (two independent experiments). (B) Flow cytometry analysis of CEA-CAR induction in selected clones after co-culture with HER2amp SKBR3; the red box indicates the clones with the highest induction, selected for subsequent induction experiments against all target cells. Bars are SDs (three independent experiments). (C) Flow cytometry plots displaying CEA-CAR induction in NK-92 HER2 synNotch/CEA-CAR after co-culture with HER2 normal and amplified cells (numbers in the square indicate the fraction of CEA-CAR positive cells).
Figure 5
Figure 5
NK-92.5F clone characterization (A) Flow cytometry analysis of the major NK/T cell antigen markers on the NK-92 WT and on the NK-92.5F clone. (two independent experiments). (B) Dot plot showing the correlation between NK-92 WT and 5F clone mRNA expression. Black dots = all genes; red dots = NK-specific gene signature. (C) Flow cytometry histograms of CEA-CAR induction after co-culture for different times with HER2amp cells, of either the sorted population (left) or the NK-92.5F clone (right) (three independent experiments). (D) Flow cytometry histograms of CEA-CAR induction and time course suppression after removal of HER2amp target cells, of either the sorted population (left) or the NK-92.5F clone (right). %, percent of cells above the depicted positivity threshold; MFI, mean fluorescence intensity of all cells (three independent experiments).
Figure 6
Figure 6
NK-92.5F in vitro biologic activity (A) Specific killing activity of irradiated NK-92.5F against SKBR3, LS180, CRC0080, and CRC0186 cells after 48 h of co-culture at different effector:target ratio. Bars are SD (three independent experiments). Two-way ANOVA p-values: ∗p ≤ 0.05; ∗∗p ≤ 0.01; ∗∗∗p ≤ 0.001. (B) Degranulation and cytokine release upon co-culture with SKBR3, LS180, CRC0080, and CRC0186 with irradiated effectors. Bars are SDs. Two-way ANOVA p-values: ∗p ≤ 0.05; ∗∗p ≤ 0.01; ∗∗∗p ≤ 0.001 (three independent experiments for CD107a; four independent experiments for IFN-γ; three independent experiments for granzyme B). (C) Representative confocal microscopy images of CRC0080 organoids grown for 3 days in the presence of different NK-92 effectors, as indicated. Cancer cells were stained with NucBlue (blue signal), and NK-92 cells were stained with PHK26 (red signal). Original magnification ×20; scale bars, 100 μm.
Figure 7
Figure 7
NK-92.5F in vivo therapeutic efficacy (A) Representative immunofluorescence images of CEA-CAR expression by the NK-92.5F clone after injection into CRC0080 xenograft tumors; the tumor was explanted 3 days after intratumoral inoculation of NK-92.5F (red: pkh26-labeled NK-92.5F cells; green: CEA-CAR antibody; blue: NucBlue-labeled cancer cells). Original magnification ×10; scale bars, 100 μm (two independent experiments). (B) In vivo growth of CRC0080, CRC0186, and LS180 xenografts treated with different NK-92 effectors, as indicated. We intravenously injected 5 × 106 irradiated effectors twice a week for a total of six injections. CTRL, PBS. Bars are SEM. Growth curves are stopped when the first mouse of the control cohort has reached the humane endpoint. Two-way ANOVA p-values: ∗p ≤ 0.05, ∗∗p ≤ 0.01, ∗∗∗p ≤ 0.001, ∗∗∗∗p ≤ 0.0001, between NK-92.5F clone vs. CTRL or WT NK-92 in CRC0080, and between NK-92.5F vs. all control cohorts in CRC0186. (C) Survival curves of mice implanted with CRC0080, CRC0186 or LS180 xenografts and intravenously injected with 5 × 106 NK-92 irradiated effector cells, as indicated. Statistical significance between CTRL and 5F clone was calculated by log rank test for trend. ∗p ≤ 0.05, ∗∗p ≤ 0.01.
Figure 8
Figure 8
Additional NK-92.5F safety and efficacy studies (A) Flow cytometry plots displaying CEA-CAR induction in NK-92.5F after co-culture with HER2amp cells, either alive or fixed, as indicated. Numbers in the squares indicate the fraction of CEA-CAR positive-cells (two independent experiments). (B) Killing activity of irradiated NK-92.5F preactivated by incubation for 24 h on top of a monolayer of fixed HER2amp CRC0080, against CRC0080, or LS180 cells, at different time intervals after pre-activation and at different effector:target ratio, as indicated. Bars are SD (three independent experiments). (C) Killing activity of irradiated NK-92.5F and NK-92.F3 clones, against SKBR3, LS180, CRC0080, and CRC0186 cells after 48 h of co-culture at different effector:target ratios. Bars are SD (two independent experiments). (D) In vivo growth of CRC0186 xenografts treated with NK-92.5F (HER2 synNotch/CEA-CAR) or with NK-92.F3 (constitutive CEA-CAR), as indicated. We intravenously injected 5 × 106 irradiated effectors twice a week for a total of six injections, CTRL, PBS. Bars are SEM. Growth curves are stopped when the first mouse of the control cohort has reached the humane endpoint. Two-way ANOVA p values (B, C, and D): ∗p ≤ 0.05, ∗∗p ≤ 0.01, ∗∗∗p ≤ 0.001, ∗∗∗∗p ≤ 0.0001, between NK-92.5F or NK-92.F3 vs. CTRL. (E) Survival curves of CRC0186 xenografts intravenously injected with 5 × 106 NK-92 irradiated effector cells, as indicated. Statistical significance between CTRL and 5F/F3 clones was calculated by log rank test for trend. ∗p ≤ 0.05.

References

    1. Rawla P., Sunkara T., Barsouk A. Epidemiology of colorectal cancer: incidence, mortality, survival, and risk factors. Prz. Gastroenterol. 2019;14:89–103. doi: 10.5114/pg.2018.81072. - DOI - PMC - PubMed
    1. Morgan E., Arnold M., Gini A., Lorenzoni V., Cabasag C.J., Laversanne M., Vignat J., Ferlay J., Murphy N., Bray F. Global burden of colorectal cancer in 2020 and 2040: incidence and mortality estimates from GLOBOCAN. Gut. 2023;72:338–344. doi: 10.1136/gutjnl-2022-327736. - DOI - PubMed
    1. Siegel R.L., Miller K.D., Jemal A. Cancer statistics, 2020. CA. Cancer J. Clin. 2020;70:7–30. doi: 10.3322/caac.21590. - DOI - PubMed
    1. Rumpold H., Niedersüß-Beke D., Heiler C., Falch D., Wundsam H.V., Metz-Gercek S., Piringer G., Thaler J. Prediction of mortality in metastatic colorectal cancer in a real-life population: a multicenter explorative analysis. BMC Cancer. 2020;20:1149. doi: 10.1186/s12885-020-07656-w. - DOI - PMC - PubMed
    1. Chau I., Cunningham D. Treatment in Advanced Colorectal Cancer: what, when and How? Preprint. 2009. - DOI - PMC - PubMed

MeSH terms