. 2024 Oct 1;23(10):1404-1417.
doi: 10.1158/1535-7163.MCT-23-0933.

AKT Inhibition Sensitizes to Polo-Like Kinase 1 Inhibitor Onvansertib in Prostate Cancer

Affiliations

AKT Inhibition Sensitizes to Polo-Like Kinase 1 Inhibitor Onvansertib in Prostate Cancer

Mannan Nouri et al. Mol Cancer Ther. .

Abstract

Polo-like kinase 1 (PLK1) inhibitors have had limited antitumor efficacy as single agents, and focus of current efforts is on combination therapies. We initially confirmed that the PLK1-specific inhibitor onvansertib (ONV) could enhance responses to a PARP inhibitor (olaparib) in prostate cancer xenografts. To identify more effective combinations, we screened a library of bioactive compounds for efficacy in combination with ONV in LNCaP prostate cancer cells, which identified a series of compounds including multiple AKT inhibitors. We confirmed in vitro synergy between ONV and the AKT inhibitor ipatasertib (IPA) and found that the combination increased apoptosis. Mechanistic studies showed that ONV increased expression of the antiapoptotic protein SURVIVIN and that this was mitigated by IPA. Studies in three PTEN-deficient prostate cancer xenograft models showed that cotreatment with IPA and ONV led to significant tumor growth inhibition compared with monotherapies. Together, these in vitro and in vivo studies demonstrate that the efficacy of PLK1 antagonists can be enhanced by PARP or AKT inhibition and support further development of these combination therapies.


Conflict of interest statement

Disclosure of potential conflict of interests: Maya Ridinger is an employee and shareholder of Cardiff Oncology, Inc. All other authors declare no potential conflicts of interest.

Figures

Figure 1.
Figure 1.. Combination onvansertib and olaparib responses in 2-D and 3-D in vitro models.
A-D, Dose escalation of olaparib +/− 40 nM onvansertib in prostate cancer cells measured at 48 hours post-treatment with DMSO or onvansertib. E, Dose escalation of olaparib +/− 40 nM onvansertib in LNCaP cells in 3-D Matrigel embedded spheroids measured at 6 days post-treatment with olaparib, with addition of DMSO or onvansertib during last 48 hours of treatment. Data are presented as CellTiterGlo ATP luminescence mean ± standard deviation of a representative experiment with at least two biological replicates. Data were analyzed by two-way ANOVA with Tukey multiple test correction. *p<0.05, **p<0.01, ***p<0.001, ****p<0.0001.
Figure 2.
Figure 2.. Combination olaparib and onvansertib responses in in vivo models.
A-H, Tumor volume measurements over treatment course and percent tumor volume change from baseline calculated at vehicle treated cohort final day. Tumor volume graphs analyzed by Two-way ANOVA with Tukey multiple test correction. Percent tumor volume change from baseline graphs analyzed by one-way ANOVA with Tukey multiple test correction. *p<0.05, **p<0.01, ***p<0.001, ****p<0.0001. Animals were dosed with ONV (50mg/kg) or OLP (50 mg/kg) 5 days on, 2 days off. All drugs were administered via oral gavage.
Figure 3.
Figure 3.. Onvansertib primary screen with small molecule compound library with known targets.
A, Graphical representation of primary drug screen protocol. B, Heat map depicting mean luminescence in DOI and DOI+onvansertib in LNCaP cells 96-hours post-onvansertib and 48-hours post-DOI treatment employing the CellTiterGlo ATP luminescence assay. C, Heat map of percent of control analysis of all DOI doses +/− onvansertib (left), and region where potentially synergistic hits are likely to filter out (right). D, Heat map of z-scores of all DOI doses +/− onvansertib (left), and region where potentially synergistic hits are likely to filter out (right).
Figure 4.
Figure 4.. AKT inhibition enhances growth arresting effect of onvansertib in 2-D or 3-D in vitro models.
A, Dose escalation of onvansertib +/− 1 μM MK-2206 in LNCaP cells measured after 48 hours of single or combination treatment. B, Onvansertib +/− 1 μM MK-2206 in LNCaP 3-D Matrigel embedded spheroids measured at 6 days post-treatment. C-D, Dose escalation of onvansertib +/− 1 mM MK-2206 in prostate cancer cells measured at 48 hours post-treatment. E, Dose escalation of ipatasertib +/− 40 nM onvansertib in LNCaP cells measured at 48-hours post-treatment. F, Dose escalation of ipatasertib +/− 40 nM onvansertib in LNCaP cells in 3-D Matrigel embedded spheroids measured at 6 days post-treatment. G-H, Dose escalation of ipatasertib or MK-2206 +/− 20 nM Volasertib in LNCaP cells measured at 48-hours post-treatment. I-J, Crystal violet colony assay (left) and quantification (right) in ipatasertib or onvansertib treated LNCaP and LNCaP-95 cells. Data presented as mean ± standard deviation of a representative experiments from at least two biological replicates. Data were analyzed by two-way ANOVA with Tukey multiple test correction. *p<0.05, **p<0.01, ***p<0.001, ****p<0.0001.
Figure 5.
Figure 5.. Secondary screen identifies ipatasertib as significantly synergistic onvansertib in in vitro models.
A, Graphical representation of secondary drug screen dosing protocol. B, Response surface model depicting synergy mapped to normalized mean luminescence in ipatasertib +/− onvansertib in LNCaP cells 48-hours post-treatment employing the CellTiterGlo ATP luminescence assay. C, Synergy scores and confidence intervals for dose matrix of ipatasertib +/− onvansertib treated LNCaP cells. Asterisk inside score box indicate significant synergy (>10) or antagonism (<−10) at dose combination. The Loewe, HSA and Bliss synergy models are shown.
Figure 6.
Figure 6.. Ipatasertib and onvansertib synergize in in vivo models.
A-F, Tumor volume measurements over treatment course and percent tumor volume change from baseline calculated at vehicle treated cohort final day. Tumor volume graphs analyzed by Two-way ANOVA with Tukey multiple test correction. Percent tumor volume change from baseline graphs analyzed by one-way ANOVA with Tukey multiple test correction. *p<0.05, **p<0.01, ***p<0.001, ****p<0.0001. Animals were dosed with 50mg/kg ONV, 50 mg/kg IPA for LNCaP-95 and BCaP-1, and 30 mg/kg IPA for PC-3, 5 days on, 2 days off. All drugs were administered via oral gavage.
Figure 7.
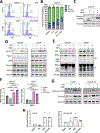
Figure 7.. Ipatasertib prevents onvansertib-induced SURVIVIN upregulation.
A, Histograms of LNCaP cells treated with DMSO, ipatasertib (300 nM), onvansertib (40 nM), and combination ipatasertib+onvansertib depicting cell cycle as determined through PI stained DNA content assessed using flow cytometry. One representative experiment from two biological replicates is shown. B, Percent of population in each stage of the cell cycle as determined by PI stained DNA measured by flow cytometry. Mean ± standard deviation of two biological replicates is shown. C, Western blot of LNCaP cells treated with DMSO, ipatasertib (300 nM), onvansertib (40 nM) or combined ipatasertib+onvansertib for 48-hours, and probed for cleaved caspase 3. Representative blots of at least two biological replicates for each protein shown. Vinculin represents the loading control. D-E, Western blot of LNCaP and VCaP cell lines treated with DMSO, ipatasertib (300 nM), onvansertib (40 nM) or combined ipatasertib+onvansertib for 48-hours, and probed for pro-apoptotic and anti-apoptotic proteins. Representative blots of at least three biological replicates for each protein shown. F, BIRC5 gene expression in LNCaP and VCaP cells treated with onvansertib (40 nM) and/or ipatasertib (300 nM) for 48-hours. Mean of biological replicates for each cell line are shown. Data were analyzed by one-way ANOVA with Tukey multiple test correction. G, Western blot of VCaP and LNCaP-95 cells treated with DMSO, ipatasertib (300 nM), onvansertib (40 nM) or combined ipatasertib+onvansertib for 48-hours. Representative blot is shown. H, Densitometry quantification of phospho-SURVIVIN normalized to total SURVIVIN. Data from three biological replicates shown. Data were analyzed by two-way ANOVA with Tukey multiple test correction.

Similar articles

Cited by

References

    1. Gebrael G, Fortuna GG, Sayegh N, Swami U, Agarwal N. Advances in the treatment of metastatic prostate cancer. Trends Cancer 2023;9(10):840–54 doi 10.1016/j.trecan.2023.06.009. - DOI - PubMed
    1. Mittal A, Sridhar SS, Ong M, Jiang DM. Triplet Therapy in Metastatic Castrate Sensitive Prostate Cancer (mCSPC)-A Potential New Standard of Care. Curr Oncol 2023;30(4):4365–78 doi 10.3390/curroncol30040332. - DOI - PMC - PubMed
    1. Kalous J, Aleshkina D. Multiple Roles of PLK1 in Mitosis and Meiosis. Cells 2023;12(1) doi 10.3390/cells12010187. - DOI - PMC - PubMed
    1. Moore XTR, Gheghiani L, Fu Z. The Role of Polo-Like Kinase 1 in Regulating the Forkhead Box Family Transcription Factors. Cells 2023;12(9) doi 10.3390/cells12091344. - DOI - PMC - PubMed
    1. Lowery DM, Clauser KR, Hjerrild M, Lim D, Alexander J, Kishi K, et al. Proteomic screen defines the Polo-box domain interactome and identifies Rock2 as a Plk1 substrate. EMBO J 2007;26(9):2262–73 doi 10.1038/sj.emboj.7601683. - DOI - PMC - PubMed

MeSH terms