. 2024 Jun 4:18:1390742.
doi: 10.3389/fncel.2024.1390742. eCollection 2024.

Region and layer-specific expression of GABAA receptor isoforms and KCC2 in developing cortex

Affiliations

Region and layer-specific expression of GABAA receptor isoforms and KCC2 in developing cortex

Kirill Zavalin et al. Front Cell Neurosci. .

Abstract

Introduction: γ-Aminobutyric acid (GABA) type A receptors (GABAARs) are ligand-gated Cl-channels that mediate the bulk of inhibitory neurotransmission in the mature CNS and are targets of many drugs. During cortical development, GABAAR-mediated signals are significantly modulated by changing subunit composition and expression of Cl-transporters as part of developmental processes and early network activity. To date, this developmental evolution has remained understudied, particularly at the level of cortical layer-specific changes. In this study, we characterized the expression of nine major GABAAR subunits and K-Cl transporter 2 (KCC2) in mouse somatosensory cortex from embryonic development to postweaning maturity.

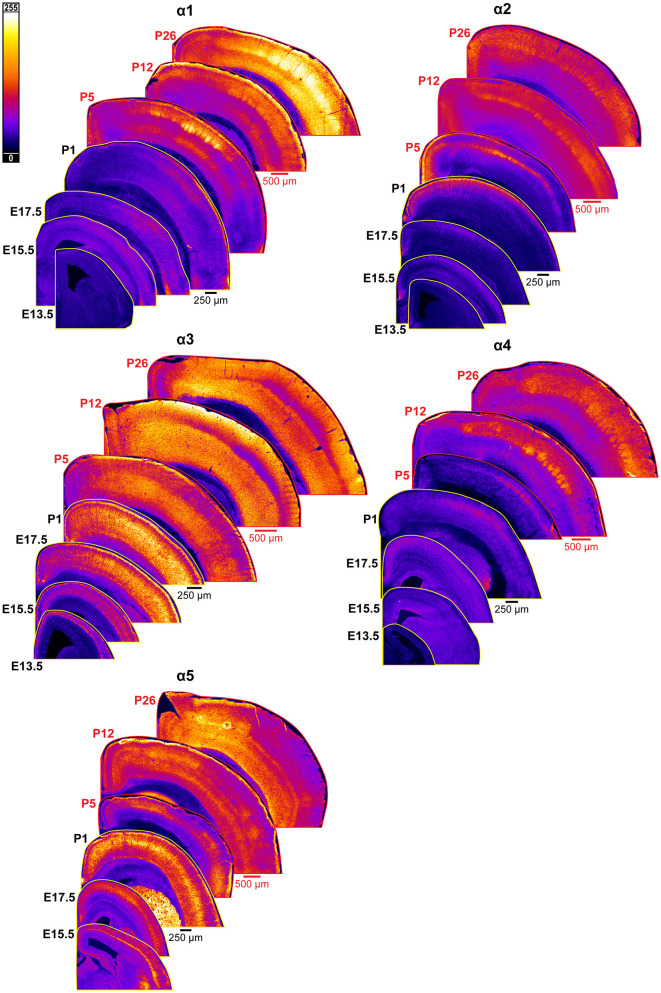
Methods: We evaluated expression of α1-5, β2-3, γ2, and δ GABAAR subunits using immunohistochemistry and Western blot techniques, and expression of KCC2 using immunohistochemistry in cortices from E13.5 to P25 mice.

Results: We found that embryonic cortex expresses mainly α3, α5, β3, and γ2, while expression of α1, α2, α4, β2, δ, and KCC2 begins at later points in development; however, many patterns of nuanced expression can be found in specific lamina, cortical regions, and cells and structures.

Discussion: While the general pattern of expression of each subunit and KCC2 is similar to previous studies, we found a number of unique temporal, regional, and laminar patterns that were previously unknown. These findings provide much needed knowledge of the intricate developmental evolution in GABAAR composition and KCC2 expression to accommodate developmental signals that transition to mature neurotransmission.

Keywords: GABA-A receptors; GABAA subtypes; Western blot (WB); cortical development; developmental expression pattern; immunohistochemistry (IHC); potassium chloride co-transporter 2 (KCC2).


Conflict of interest statement

The authors declare that the research was conducted in the absence of any commercial or financial relationships that could be construed as a potential conflict of interest.

Figures

Figure 1
Figure 1
Sample P26 images showing region-specific immunolabeling patterns of GABAAR subunits in the CNS. Regions with the highest expression were used for setting acquisition settings and the maximum grading threshold for quantifying subunit expression within cortex.
Figure 2
Figure 2
Expression of GABAAR α1-5 subunits in developing cortex. Coronal sections are overlaid from embryonic day E13.5/E15.5 on the bottom left to postnatal day 26 on the top right separately for each α subunit. All sections are oriented from ventral bottom to dorsal top, with lateral cortex on the right. Separate spatial scaling has been used for sections E13.5-P1 (black scale bar) and P5-P26 (red scale bar), separately for each subunit. Signal is represented using a subunit-specific heat map lookup table to highlight differences in regional expression. Heatmap intensity scaling is shown by the bar in top left.
Figure 3
Figure 3
GABAAR α1 expression in barrel field cortex from embryonic age to maturity. (A) Exemplar images of α1 immunoreactivity in barrel field cortex across development. Scale bar = 250 μm. (B) Grading of immunofluorescence intensity across cortical lamina, where + + ++ is the maximal α1 signal that could be detected in brain at P26. (C) Quantification of GABAAR α1 protein in cortical samples by Western blot (WB), with a timeline of all points on the left and binned stages tested for significance on the right. ****P < 0.0001 by one-way ANOVA with Šídák's multiple comparisons; n in mice/age: 3/E15.5, 8/P1, 3/P5, 4/P10, 4/P15, 4/P18, and 4/P25. L1–L6, layer 1–layer 6; MZ, marginal zone; SP, subplate; CP, cortical plate; ND, not determined; also refer to “Lamina in Grading Table and Figures” section in Methods.
Figure 4
Figure 4
GABAAR α2 expression in barrel field cortex from embryonic age to maturity. (A) Exemplar images of α2 immunoreactivity in barrel field cortex across development. Scale bar = 250 μm. (B) Grading of immunofluorescence intensity across cortical lamina, where + + ++ is the maximal α2 signal that could be detected in brain at P26. (C) Quantification of GABAAR α2 protein in cortical samples by Western blot, with a timeline of all points on the left and binned stages tested for significance on the right. ****P < 0.0001, **P < 0.01 by one-way ANOVA with Šídák's multiple comparisons; n in mice/age: 3/E13.5; 3/E15.5, 3/E17.5, 6/P1, 4/P3, 5/P5, 5/P7, 4/P10, 3/P15, 4/P18, and 5/P25. L1–L6, layer 1–layer 6; MZ, marginal zone; SP, subplate; CP, cortical plate; also refer to “Lamina in Grading Table and Figures” section in Methods.
Figure 5
Figure 5
Fibers of radial glia co-localize with GABAAR α2, but not GABAAR α3. (A) Both GABAAR α2 and α3 immunolabeling showed a pattern of ascending cortical fibers, which are prominent in the CP/developing layers 2/3 for α3 (right) and are found throughout the cortical column for α2 (left) in embryonic and early postnatal period. These fibers resemble radial glia marked by RC2 (middle). (B) The radial glia marker RC2 co-localized with α2-immunopositive fibers (left, arrows), but not with α3-immunopositive fibers (right, arrows). Note that white arrows denote fibers immunopositive for α2 and α3, while green empty arrows indicate radial glia fibers. (C) Subcortical expression of α3-positive fibers has a different pattern than radial glia. The yellow dotted line in (A, C) indicates the basal margin of the subplate, while red dotted line in (C) indicates the margin between intermediate zone/white matter and the striatum. All images are oriented basal bottom to apical top.
Figure 6
Figure 6
GABAAR α3 expression in barrel field cortex from embryonic age to maturity. (A) Exemplar images of α3 immunoreactivity in barrel field cortex across development. Scale bar = 250 μm. (B) Grading of immunofluorescence intensity across cortical lamina, where + + ++ is the maximal α3 signal that could be detected in brain at P26. (C) Quantification of GABAAR α3 protein in cortical samples by Western blot, with a timeline of all points on the left and binned stages tested for significance on the right. *P < 0.05 by one-way ANOVA with Šídák's multiple comparisons; n in mice/age: 3/E13.5; 3/E15.5, 3/E17.5, 6/P1, 4/P3, 6/P5, 6/P7, 4/P10, 3/P15, 4/P18, 6/P25. L1-L6, layer 1-layer 6; MZ, marginal zone; SP, subplate; CP, cortical plate; also refer to “Lamina in Grading Table and Figures” section in Methods.
Figure 7
Figure 7
GABAAR α3 expression in fibers of the internal capsule during embryonic development. (A) E17.5 coronal section showing prominent α3 immunolabeling of internal capsule fibers in the white matter/intermediate zone located below the subplate and running medioventrally through the striatum. These regions of interest are enlarged in the inset. (B) α3-immunolabeled fibers are absent in the α3-knockout mouse (α3 KO, right), but consistently present in sections from wildtype mice (left). The yellow dotted line in (A, B) indicates the basal margin of the subplate. All images are oriented ventral bottom to dorsal top, with lateral cortex on the right.
Figure 8
Figure 8
GABAAR α4 expression in barrel field cortex from embryonic age to maturity. (A) Exemplar images of α4 immunoreactivity in barrel field cortex across development. Scale bar = 250 μm. (B) Grading of immunofluorescence intensity across cortical lamina, where + + ++ is the maximal α4 signal that could be detected in brain at P26. (C) Quantification of GABAAR α4 protein in cortical samples by Western blot, with a timeline of all points on the left and binned stages tested for significance on the right. ****P < 0.0001 by one-way ANOVA with Šídák's multiple comparisons; n in mice/age: 3/E13.5; 3/E15.5, 3/E17.5, 6/P1, 3/P3, 4/P5, 3/P7, 6/P10, 3/P15, 5/P18, and 4/P25. L1–L6, layer 1–layer 6; MZ, marginal zone; SP, subplate; CP, cortical plate; also refer to “Lamina in Grading Table and Figures” section in Methods.
Figure 9
Figure 9
GABAAR α5 expression in barrel field cortex from embryonic age to maturity. (A) Exemplar images of α5 immunoreactivity in barrel field cortex across development. Scale bar = 250 μm. (B) Grading of immunofluorescence intensity across cortical lamina, where + + ++ is the maximal α5 signal that could be detected in brain at P26. (C) Quantification of GABAAR α5 protein in cortical samples by Western blot, with a timeline of all points on the left and binned stages tested for significance on the right. ****P < 0.0001 by one-way ANOVA with Šídák's multiple comparisons; n in mice/age: 3/E13.5; 3/E15.5, 3/E17.5, 3/P1, 3/P3, 4/P5, 3/P7, 5/P10, 3/P15, 7/P18, and 6/P25. L1–L6, layer 1–layer 6; MZ, marginal zone; SP, subplate; CP, cortical plate; ND, not determined; also refer to “Lamina in Grading Table and Figures” section in Methods.
Figure 10
Figure 10
Expression of GABAAR β2, β3, δ, and γ2 subunits in developing cortex. Coronal sections are overlaid from embryonic day E13.5/E15.5 on the bottom left to postnatal day 26 on the top right separately for each subunit. All sections are oriented from ventral bottom to dorsal top, with lateral cortex on the right. Separate scaling has been used for sections E13.5-P1 (black scale bar) and P5-P26 (red scale bar), separately for each subunit. Signal is represented using a heat map lookup table to highlight differences in regional expression. Heatmap intensity scaling is shown by the bar in top left.
Figure 11
Figure 11
GABAAR δ expression in barrel field cortex from embryonic age to maturity. (A) Exemplar images of δ immunoreactivity in barrel field cortex across development. Scale bar = 250 μm. (B) Grading of immunofluorescence intensity across cortical lamina, where + + ++ is the maximal δ signal that could be detected in brain at P26. (C) Quantification of GABAAR δ protein in cortical samples by Western blot, with a timeline of all points on the left and binned stages tested for significance on the right. ****P < 0.0001 by one-way ANOVA with Šídák's multiple comparisons; n in mice/age: 4/E13.5; 3/E15.5, 4/P1, 4/P5, 3/P10, 4/P15, 5/P18, and 3/P25. L1–L6, layer 1–layer 6; MZ, marginal zone; SP, subplate; CP, cortical plate; ND, not determined; also refer to “Lamina in Grading Table and Figures” section in Methods.
Figure 12
Figure 12
GABAAR γ2 expression in barrel field cortex from embryonic age to maturity. (A) Exemplar images of γ2 immunoreactivity in barrel field cortex across development. Of note, the sections shown here were stained at the same time, but L1 was damaged in the P12 sections. Scale bar = 250 μm. (B) Grading of immunofluorescence intensity across cortical lamina, where + + ++ is the maximal γ2 signal that could be detected in brain at P26. (C) Quantification of GABAAR γ2 protein in cortical samples by Western blot, with a timeline of all points on the left and binned stages tested for significance on the right. ****P < 0.0001, ***P < 0.001, **P < 0.01 by one-way ANOVA with Šídák's multiple comparisons; n in mice/age: 3/E13.5, 3/E15.5, 3/E17.5, 6/P1, 3/P3, 3/P5, 3/P7, 3/P10, 4/P15, 4/P18, and 4/P25. L1–L6, layer 1–layer 6; MZ, marginal zone; SP, subplate; CP, cortical plate; ND, not determined; also refer to “Lamina in Grading Table and Figures” section in Methods.
Figure 13
Figure 13
GABAAR β2 expression in barrel field cortex from embryonic age to maturity. (A) Exemplar images of β2 immunoreactivity in barrel field cortex across development. Scale bar = 250 μm. (B) Grading of immunofluorescence intensity across cortical lamina, where + + ++ is the maximal β2 signal that could be detected in brain at P26. (C) Quantification of GABAAR β2 protein in cortical samples by Western blot, with a timeline of all points on the left and binned stages tested for significance on the right. ****P < 0.0001, ***P < 0.001 by one-way ANOVA with Šídák's multiple comparisons; n in mice/age: 3/E13.5; 3/E15.5, 3/E17.5, 6/P1, 3/P3, 3/P5, 3/P7, 4/P10, 3/P15, 4/P18, and 3/P25. L1–L6, layer 1–layer 6; MZ, marginal zone; SP, subplate; CP, cortical plate; also refer to “Lamina in Grading Table and Figures” section in Methods.
Figure 14
Figure 14
GABAAR β3 expression in barrel field cortex from embryonic age to maturity. (A) Exemplar images of β3 immunoreactivity in barrel field cortex across development. Scale bar = 250 μm. (B) Grading of immunofluorescence intensity across cortical lamina, where + + ++ is the maximal β3 signal that could be detected in brain at P26. (C) Quantification of GABAAR β3 protein in cortical samples by Western blot, with a timeline of all points on the left and binned stages tested for significance on the right. ****P < 0.0001 by one-way ANOVA with Šídák's multiple comparisons; n in mice/age: 4/E13.5, 4/E15.5, 4/E17.5, 4/P1, 4/P5, 4/P10, 4/P15, 4/P18, and 4/P25. L1–L6, layer 1–layer 6; MZ, marginal zone; SP, subplate; CP, cortical plate; also refer to “Lamina in Grading Table and Figures” section in Methods.
Figure 15
Figure 15
KCC2 expression in developing cortex. Coronal sections are overlaid from embryonic day E13.5 on the bottom left to postnatal day 19 on the top right, and concensus grading of immunofluorescence intensity is on bottom right. All sections are oriented from ventral bottom to dorsal top, with lateral cortex on the right. Separate scaling has been used for sections E13.5-P1 (black scale bar) and P4-P19 (red scale bar). Signal is represented using a heat map lookup table to highlight differences in regional expression. Heatmap intensity scaling is shown by the bar in top left. For grading of immunofluorescence intensity, + + ++ is the maximal KCC2 signal that could be detected in brain at P19+. L1–L6, layer 1–layer 6; SP, subplate; also refer to “Lamina in Grading Table and Figures” section in Methods.

Similar articles

References

    1. Abe P., Molnar Z., Tzeng Y. S., Lai D. M., Arnold S. J., Stumm R. (2015). Intermediate progenitors facilitate intracortical progression of thalamocortical axons and interneurons through CXCL12 chemokine signaling. J. Neurosci. 35, 13053–13063. 10.1523/JNEUROSCI.1488-15.2015 - DOI - PMC - PubMed
    1. Agmon A., Yang L. T., O'dowd D. K., Jones E. G. (1993). Organized growth of thalamocortical axons from the deep tier of terminations into layer IV of developing mouse barrel cortex. J. Neurosci. 13, 5365–5382. 10.1523/JNEUROSCI.13-12-05365.1993 - DOI - PMC - PubMed
    1. Allene C., Cattani A., Ackman J. B., Bonifazi P., Aniksztejn L., Ben Ari Y., et al. . (2008). Sequential generation of two distinct synapse-driven network patterns in developing neocortex. J Neurosci. 28, 12851–12863. 10.1523/JNEUROSCI.3733-08.2008 - DOI - PMC - PubMed
    1. Bartolini G., Ciceri G., Marín O. (2013). Integration of GABAergic interneurons into cortical cell assemblies: lessons from embryos and adults. Neuron 79, 849–864. 10.1016/j.neuron.2013.08.014 - DOI - PubMed
    1. Bayer S. A., Altman J. (1990). Development of layer I and the subplate in the rat neocortex. Exp. Neurol. 107, 48–62. 10.1016/0014-4886(90)90062-W - DOI - PubMed

LinkOut - more resources