. 2024 Jun 4:14:1392417.
doi: 10.3389/fonc.2024.1392417. eCollection 2024.

SIRPG promotes lung squamous cell carcinoma pathogenesis via M1 macrophages: a multi-omics study integrating data and Mendelian randomization

Affiliations

SIRPG promotes lung squamous cell carcinoma pathogenesis via M1 macrophages: a multi-omics study integrating data and Mendelian randomization

Guocai Mao et al. Front Oncol. .

Abstract

Background: Squamous cell carcinoma of the lung (LUSC) is a severe and highly lethal malignant tumor of the respiratory system, and its molecular mechanisms at the molecular level remain unc\lear.

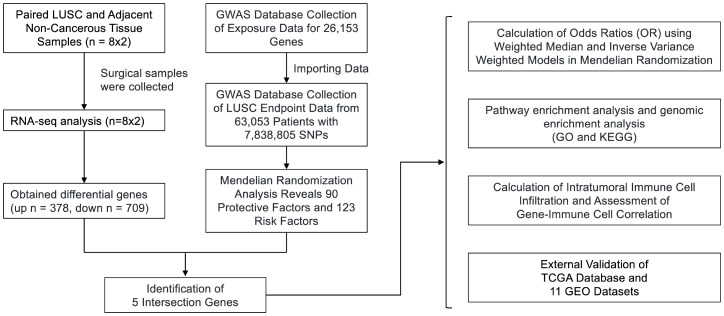
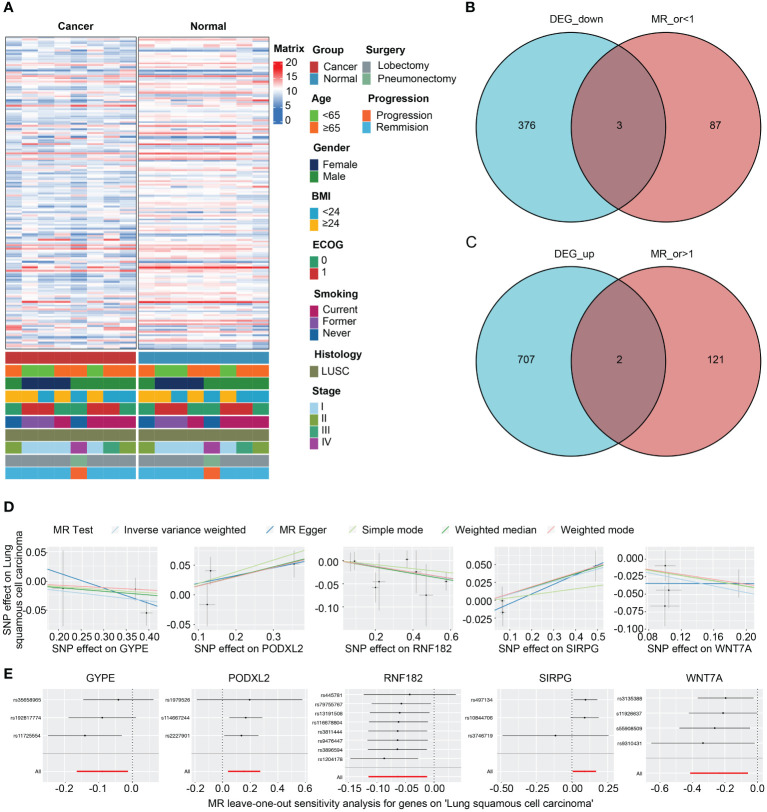
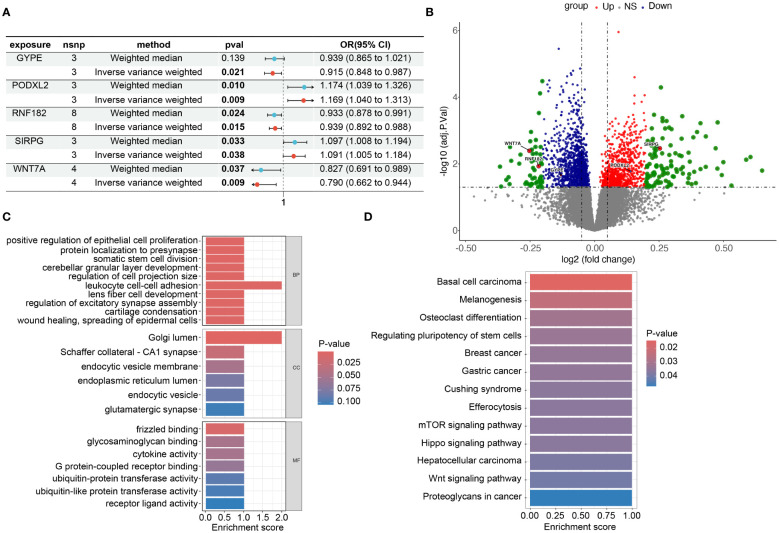
Methods: We acquired RNA-seq data from 8 surgical samples obtained from early-stage LUSC and adjacent non-cancerous tissues from 3 different centers. Utilizing Deseq2, we identified 1088 differentially expressed genes with |LogFC| > 1 and a p-value < 0.05 threshold. Furthermore, through MR analysis of Exposure Data for 26,153 Genes and 63,053 LUSC Patients, incorporating 7,838,805 SNPs as endpoints, we identified 213 genes as potential exposure factors.

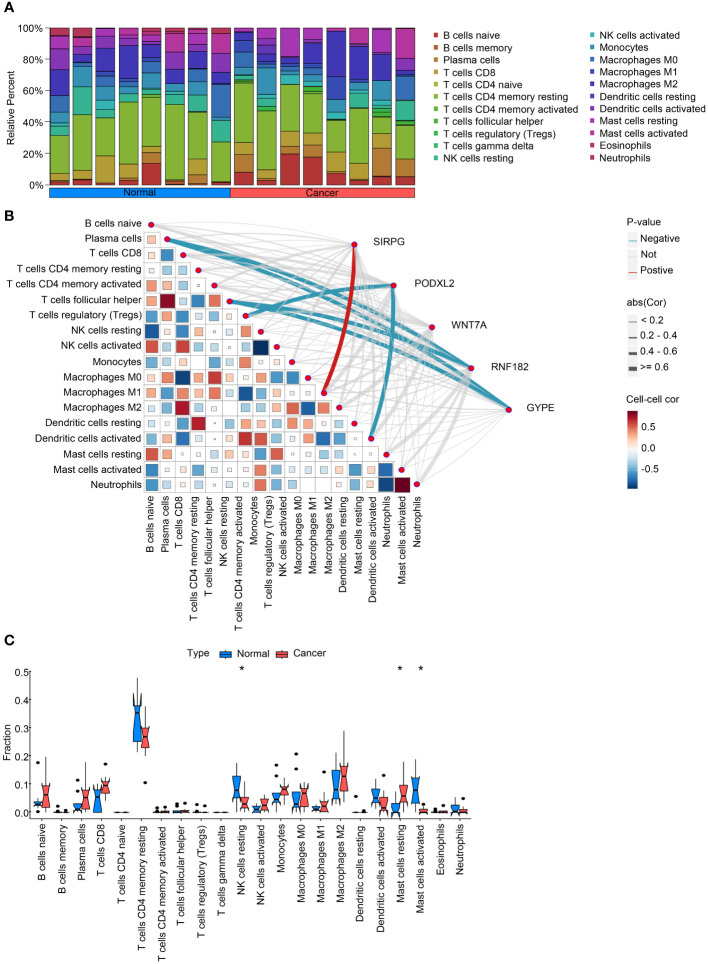
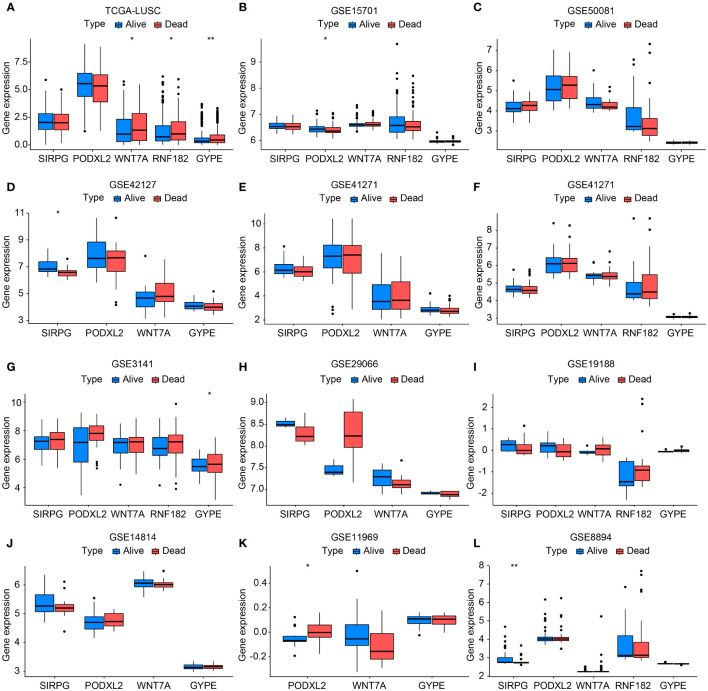
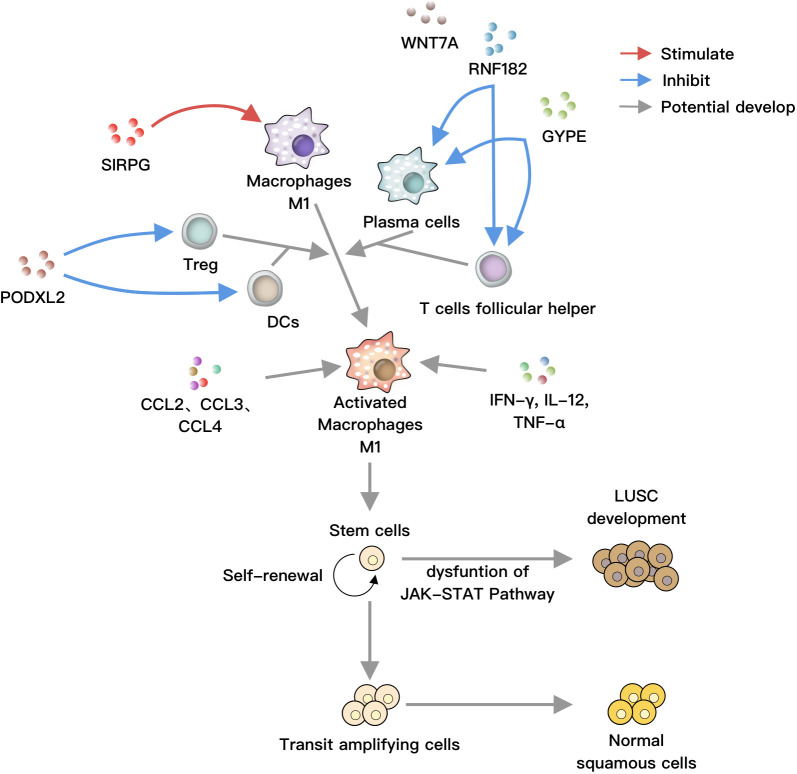
Results: After intersecting the results, we identified 5 differentially expressed genes, including GYPE, PODXL2, RNF182, SIRPG, and WNT7A. PODXL2 (OR 95% CI, 1.169 (1.040 to 1.313)) was identified as an exposed risk factor, with p-values less than 0.01 under the inverse variance weighted model. GO and KEGG analyses revealed enhanced ubiquitin-protein transferase activity and activation of pathways such as the mTOR signaling pathway and Wnt signaling pathway. Immune infiltration analysis showed downregulation of Plasma cells, T cells regulatory (Tregs), and Dendritic cells activated by the identified gene set, while an enhancement was observed in Macrophages M1. Furthermore, we externally validated the expression levels of these five genes using RNA-seq data from TCGA database and 11 GEO datasets of LUSC, and the results showed SIRPG could induce LUSC.

Conclusion: SIRPG emerged as a noteworthy exposure risk factor for LUSC. Immune infiltration analysis highlighted Macrophages M1 and mTOR signaling pathway play an important role in LUSC.

Keywords: Mendelian randomization; RNA-seq; SIRPG; immune infiltration; squamous cell carcinoma of the lung.


Conflict of interest statement

The authors declare that the research was conducted in the absence of any commercial or financial relationships that could be construed as a potential conflict of interest.

Figures

Figure 1
Figure 1
Flowchart of the study design. We obtained RNA-seq data from 8 surgical samples of LUSC and adjacent non-cancerous tissues from 3 centers. Using DESeq2, we identified 1088 differentially expressed genes with |LogFC| > 1 and p-value < 0.05. Additionally, MR analysis of Exposure Data for 26,153 Genes and 63,053 LUSC Patients with 7,838,805 SNPs as endpoints yielded 213 genes as potential exposure factors. After intersecting the results, we identified 5 differentially expressed genes, namely GYPE, PODXL2, RNF182, SIRPG, and WNT7A. PODXL2 was identified as an exposed risk factor, with p-values less than 0.01 under the inverse variance weighted model. GO and KEGG analyses revealed enhanced ubiquitin-protein transferase activity and activation of pathways such as the mTOR signaling pathway and Wnt signaling pathway. Immune infiltration analysis indicated downregulation of Plasma cells, T cells regulatory (Tregs), and Dendritic cells activated by the identified gene set, while an enhancement was observed in Macrophages M1. Furthermore, we externally validated the expression levels of these five genes using RNA-seq data from TCGA database and 11 GEO datasets of LUSC, and the results showed that SIRPG could induce LUSC.
Figure 2
Figure 2
Analysis of intratumoral immune cell infiltration and correlation with intersecting genes. (A) provides a bar chart depicting the proportion of immune cell infiltration in both cancerous and adjacent non-cancerous samples, offering insights into the differences in immune cell composition between the two tissue types. (B) presents a heatmap illustrating the correlation between immune cell infiltration scores and the expression levels of intersecting genes, providing information on potential associations between gene expression and immune cell infiltration. (C) compares the expression levels of immune cell infiltration scores in cancerous and adjacent non-cancerous samples, highlighting any differences in immune cell infiltration patterns between the two tissue types. These analyses contribute to our understanding of the interplay between intratumoral immune cell infiltration and intersecting genes in the context of lung squamous cell carcinoma. *P<0.05.
Figure 3
Figure 3
Bar chart validating the expression levels between TCGA-LUSC and RNA-seq data (GSE11969, GSE14814, GSE157011, GSE19188, GSE29066, GSE30219, GSE3141, GSE37745, GSE41271, GSE42127, GSE50081, and GSE8894) in terms of progression/death and survival groups (A-L). In this bar chart, we compare the expression levels of the genes of interest between The Cancer Genome Atlas-Lung Squamous Cell Carcinoma (TCGA-LUSC) dataset and various RNA-seq datasets representing different clinical outcomes, including progression/death and survival groups. The comparison aims to validate the expression patterns observed in TCGA-LUSC across multiple independent datasets, providing robustness to our findings and enhancing the reliability of the identified gene signatures associated with disease progression and patient survival. Each bar represents the mean expression level of the genes in the respective dataset and clinical outcome group, with error bars indicating standard deviation or standard error where applicable. *P<0.05, **P<0.01.
Figure 4
Figure 4
Intersection of DEGs from RNA-seq analysis and effective exposure genes from MR. (A) Integrated heatmap of 8 LUSC patients with cancer and adjacent non-cancerous tissues. (B) Venn diagrams of the intersection between DEGs upregulated and downregulated, as well as MR analysis. (C) Scatter plot showing the intersection of 5 genes, which were analyzed for single nucleotide polymorphism (SNP) Mendelian randomization in relation to the risk of LUSC (lung squamous cell carcinoma). (D) Leave one out plot demonstrates the influential outlier after excluding a specific SNP. Consistent evidence for a causal effect of the exposure gene on the risk of LUSC was found even when this variant was excluded from the analysis. Effect estimates are reported per standard deviation increase in the exposure variable, and error bars represent 95% confidence intervals.
Figure 5
Figure 5
Risk and omics analysis of intersecting genes. (A) It shows forest plots of the risk estimates for the five intersecting genes obtained using both the Mendelian Randomization-Egger (ME) and Inverse Variance-Weighted (IVW) models. (B) volcano plot to illustrate the Differentially Expressed Genes (DEG), specifically highlighting the positions of the chosen genes. This plot, labeled as Figures 3B in our manuscript. Each point on the plot represents a gene, with the chosen genes ‘GYPE’, ‘PODXL2’, ‘RNF182’, ‘SIRPG’, and ‘WNT7A’ indicated and labeled accordingly. (C, D) display barplots representing the enriched Gene Ontology (GO) terms and Kyoto Encyclopedia of Genes and Genomes (KEGG) terms, respectively. These analyses provide insights into the potential biological functions and pathways associated with the intersecting genes identified in our study.
Figure 6
Figure 6
SIRPG positively regulates M1 macrophages, while RNF182 and GYPE negatively regulate plasma cells and T helper cells, respectively. PODXL2 negatively modulates T regulatory cells and dendritic cells (DCs). These cells can collectively act on M1 macrophages, which are activated by soluble factors such as IFN-γ, IL-12, TNF-α, as well as chemokines like CCL2, CCL3, and CCL4. Under normal circumstances, stem cells undergo self-renewal, proliferation, and differentiation into bronchial epithelial cells. However, under the influence of activated M1 macrophages, the JAK-STAT pathway is disrupted, leading to the differentiation of stem cells towards LUSC, ultimately resulting in lung cancer.

Similar articles

Cited by

References

    1. Socinski MA, Obasaju C, Gandara D, Hirsch FR, Bonomi P, Bunn P, et al. . Clinicopathologic features of advanced squamous NSCLC. J Thorac Oncol. (2016) 11:1411–22. doi: 10.1016/j.jtho.2016.05.024 - DOI - PubMed
    1. Socinski MA, Obasaju C, Gandara D, Hirsch FR, Bonomi P, Bunn PA, et al. . Current and emergent therapy options for advanced squamous cell lung cancer. J Thorac Oncol. (2018) 13:165–83. doi: 10.1016/j.jtho.2017.11.111 - DOI - PubMed
    1. Cancer Genome Atlas Research N . Comprehensive genomic characterization of squamous cell lung cancers. Nature. (2012) 489:519–25. doi: 10.1038/nature11404 - DOI - PMC - PubMed
    1. Deng L, Kimmel M, Foy M, Spitz M, Wei Q, Gorlova O, et al. . Estimation of the effects of smoking and DNA repair capacity on coefficients of a carcinogenesis model for lung cancer. Int J Cancer. (2009) 124:2152–8. doi: 10.1002/ijc.24149 - DOI - PMC - PubMed
    1. Paz-Elizur T, Krupsky M, Blumenstein S, Elinger D, Schechtman E, Livneh Z, et al. . DNA repair activity for oxidative damage and risk of lung cancer. J Natl Cancer Inst. (2003) 95:1312–9. doi: 10.1093/jnci/djg033 - DOI - PubMed