. 2024 Jun 3;6(3):fcae182.
doi: 10.1093/braincomms/fcae182. eCollection 2024.

Propionic acid promotes neurite recovery in damaged multiple sclerosis neurons

Affiliations

Propionic acid promotes neurite recovery in damaged multiple sclerosis neurons

Barbara Gisevius et al. Brain Commun. .

Abstract

Neurodegeneration in the autoimmune disease multiple sclerosis still poses a major therapeutic challenge. Effective drugs that target the inflammation can only partially reduce accumulation of neurological deficits and conversion to progressive disease forms. Diet and the associated gut microbiome are currently being discussed as crucial environmental risk factors that determine disease onset and subsequent progression. In people with multiple sclerosis, supplementation of the short-chain fatty acid propionic acid, as a microbial metabolite derived from the fermentation of a high-fiber diet, has previously been shown to regulate inflammation accompanied by neuroprotective properties. We set out to determine whether the neuroprotective impact of propionic acid is a direct mode of action of short-chain fatty acids on CNS neurons. We analysed neurite recovery in the presence of the short-chain fatty acid propionic acid and butyric acid in a reverse-translational disease-in-a-dish model of human-induced primary neurons differentiated from people with multiple sclerosis-derived induced pluripotent stem cells. We found that recovery of damaged neurites is induced by propionic acid and butyric acid. We could also show that administration of butyric acid is able to enhance propionic acid-associated neurite recovery. Whole-cell proteome analysis of induced primary neurons following recovery in the presence of propionic acid revealed abundant changes of protein groups that are associated with the chromatin assembly, translational, and metabolic processes. We further present evidence that these alterations in the chromatin assembly were associated with inhibition of histone deacetylase class I/II following both propionic acid and butyric acid treatment, mediated by free fatty acid receptor signalling. While neurite recovery in the presence of propionic acid is promoted by activation of the anti-oxidative response, administration of butyric acid increases neuronal ATP synthesis in people with multiple sclerosis-specific induced primary neurons.

Keywords: gut microbiome metabolites; microbiome–gut–brain axis; neurite recovery; neurodegeneration.


Conflict of interest statement

R.G. and A.H. have filed a patent on the supportive immunomodulatory effect of C3–C8 aliphatic fatty acids.

Figures

Graphical Abstract
Graphical Abstract
Figure 1
Figure 1
PA promotes neuroregeneration. (A) Characterization of pwMS-specific iPNs by RNA sequencing analyses at 4, 7, 12, 14, and 19 days of differentiation. Log10 of reads per kilobase of transcript per million mapped reads (RPKM) of the expression of neuron-specific markers is shown. Left column: Neural progenitors: Nestin (NES), cadherin 2 (CDH2), Hes family BHLH transcription factor 5 (HES5), fatty acid binding protein 7 (FABP7), paired box 6 (PAX6), tenascin C (TNC). Immature neurons: β-III tubulin (TUBB3), doublecortin (DCX), T-box brain transcription factor 1 (TBR1). Mature neurons: Neurofilament medium chain (NEFM), the dendritic marker microtubule-associated protein 2 (MAP2), neurofilament light chain (NEFL), microtubule-associated protein Tau (MAPT), RNA binding Fox-1 homologue 3 (RBFOX3). Pre-synapse: C-terminal binding protein 2 (CTBP2), synapse-specific marker synaptophysin (SYP), synaptosome-associated protein 25 (SNAP25), and bassoon (BSN). Right column: Post-synapse: Homer scaffold protein 3 (HOMER3), disc large MAGUK scaffold protein (DLG) 3 and 4, SH3 and multiple ankyrin repeat domain (SHANK) 3 and 1. Astrocytes: Solute carrier family 1 member (SLC1A) 2 and 3, S100 calcium binding protein B (S100B), aquaporin 4 (AQP4), aldehyde dehydrogenase 1 family member L1 (ALDH1L1), glial fibrillary acidic protein (GFAP). Oligodendrocytes: 2′,3′-cyclic nucleotide 3′phosphodiesterase (CNP), claudin 11 (CLDN11), myelin basic protein (MBP), oligodendrocyte transcription factor 2 (Olig2), myelin oligodendrocyte glycoprotein (MOG). (B) Representative immunohistochemical staining of iPNs by β-III tubulin and 4′,6-diamidino-2-phenylindole (DAPI) of iPNs at control condition (CTRL), following 6 h of nocodazole damage (10 µM nocodazole), following 24 h of neurite recovery in neuronal medium (CTRL-Recovery), and following 24 h of neurite recovery in neuronal medium supplemented with 100 µM PA (100 µM PA-Recovery). Scale bar 100 µm. (C) Fold change in neurite length following neurite recovery in the presence of 10 µM (n = 130), 100 µM (n = 119), and 1000 µM (n = 129) PA in comparison with CTRL-Recovery for 24 h. Data are represented as mean ± SEM, *P < 0.05, ***P < 0.001, ns = not significant, n = sum length of neurites per neuron.
Figure 2
Figure 2
PA promotes neuroregeneration mediated via FFAR signalling. (A & B) Immunohistochemical staining of FFAR 2 and 3 expression on iPNs differentiated from pwMS. IPNs are stained positive for the neuronal marker β-III tubulin, FFAR 2 and 3, and 4′,6-diamidino-2-phenylindole (DAPI). (C) Treatment of iPNs with PTX in the neurite regrowth assay following neurite damage by nocodazole inhibited PA-mediated impact on neurite sum length. CTRL-Recovery (n = 161), 100 µM PA (n = 173), 250 ng PTX (n = 166), PA plus PTX (n = 161). (D) Immunohistochemical staining of the MCT1 expression in iPNs. Neurons are stained positive for the neuronal marker β-III tubulin, MCT1, and DAPI. Scale bar within the zoom in 20 µm, in the overview of 100 µm. (E) Fold change in neurite length following pre-treatment with the MCT1 inhibitor AZD3965. Control recovery (n = 158), DMSO (n = 158), PA (n = 159), 50 nM AZD3965 (n = 160), 100 nm AZD3965 (n = 136), 50 nm AZD3965 plus PA (n = 160), 100 nm AZD3965 plus PA (n = 160). Data are represented as mean ± SEM, **P < 0.01, ***P < 0.001, ns = not significant, n = sum length of neurites per neuron. (F) Stable VEPs since PA initiation. P100 latency (in ms) did not change significantly. N = 35, n = 67, first year (n = 60), second year (n = 34), third year (n = 18), fourth year (n = 18), N = individuals analysed, n = eyes analysed. Analysed by Wilcoxon–Mann–Whitney test.
Figure 3
Figure 3
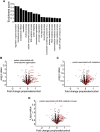
Proteomic analyses of pwMS-specific iPNs recovered in the presence of PA. (A) Enrichment score of altered protein expression in iPNs following recovery in the presence of 100 µM PA (n = 5). For statistical and categorical analysis, normalized label-free quantification intensities were log2-transformed and missing values imputed with values from a downshifted (1.8 standard deviations) normal distribution (width: 0.3 standard deviations). Difference of group means was calculated and used for one-dimensional annotation enrichment analysis based on Wilcoxon–Mann–Whitney tests. Given q-values have been calculated from P-values by the method of Benjamini and Hochberg. Proteins associated with chromosome organization (B), translation (C), and RNA catabolic processes (D) are highlighted in volcano plot. The provided fold change in BD represents the difference of the group mean values of the log2-transformed label-free quantification intensities.
Figure 4
Figure 4
STRING analyses of pwMS-specific iPNs recovered in the presence of PA. (A) STRING analysis of protein interactions associated with GTP hydrolysis and joining of the 60S ribosomal subunit and protein export pathway. (B) STRING analysis of protein interactions associated with nucleosome and histone deacetylase complex. Proteins showing higher abundances upon PA treatment are marked by red halos and proteins showing lower abundances by blue halos.
Figure 5
Figure 5
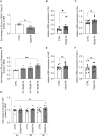
Increased neurite growth of pwMS-specific iPNs by PA is mediated by inhibition of class I/II HDAC and activation of the anti-oxidative response. (A) HDAC class I/II activity was inhibited by treatment of pwMS iPNs with PA after 30 min (CTRL n = 4, 100 µM PA n = 5). (B) Fold change of relative mRNA expression of GCL was significantly increased following recovery in the presence of PA after 6 h (n = 10). (C) mRNA expression of GSR was tendentially increased (n = 10). (D) Glutathione activity was increased following cultivation of pwMS-specific iPNs in the presence of 100 µM PA after 6 h (CTRL n = 9; 2 h 100 µM PA n = 5; 4 h 100 µM PA n = 5; 6 h 100 µM PA n = 6). (E) No difference was observed in mRNA expression of Nrf2 (n = 10) (F) and Nqo1 after 6 h of recovery (n = 10). (G) Luminescent analysis of iPN’s ATP production during cultivation in the presence of 100 µM PA for 4, 6, and 8 h (n = 9). Data are represented as mean ± SEM and analysed by the Mann–Whitney test (AC; E; F) and by the Kruskal–Wallis test with Dunn’s multiple comparison (D; G), *P < 0.05, ***P < 0.001, ns = not significant.
Figure 6
Figure 6
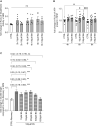
Butyric acid increases neuroregeneration in pwMS-specific iPNs. (A) Neurite recovery assay of iPNs in the presence of BA. CTRL-Recovery (n = 129), 10 µM (n = 120), 100 µM (n = 120), 250 µM (n = 120), 500 µM (n = 120), 1000 µM (n = 120). (B) BA-mediated impact on neurite regrowth by nocodazole was inhibited by PTX treatment. CTRL-Recovery (n = 120), PTX (n = 120), 10 µM BA (n = 120), 10 µM BA plus PTX (n = 120), 100 µM BA (n = 120), 100 µM BA plus PTX (n = 120). Data are represented as mean ± SEM, n = sum length of neurites per neuron. (C) HDAC class I/II activity was inhibited by treatment of pwMS iPNs with BA after 30 min (CTRL n = 4; 100 µM BA n = 5). Data are represented as mean ± SEM, analysed by the Mann–Whitney test (C), *P < 0.05, **P < 0.01, ***P < 0.001, ns = not significant.
Figure 7
Figure 7
BA’s neuroregenerative impact on iPNs is enhanced by administration of PA and increases iPN metabolic activity. (A) GSR activity in iPNs following treatment with BA for 6 h displayed no alterations evaluated by luminescent analysis (CTRL n = 9; 2 h 10 µM BA n = 6; 2 h 100 µMA BA n = 5; 4 h 10 µM BA n = 5; 4 h 100 µM BA n = 5; 6 h 10 µM BA n = 5; 6 h 100 µM BA n = 4). (B) Luminescent analysis of iPN’s ATP production during cultivation in the presence of 10 µM and 100 µM BA for 4, 6, and 8 h (n = 12). Data are represented as mean ± SEM, analysed by the Kruskal–Wallis test with Dunn’s multiple comparison. (C) Neurite recovery assay by combined treatment of different BA concentrations and 100 µM PA. CTRL-Recovery (n = 120), 10 µM BA (n = 120), 100 µM BA (n = 120), 250 µM BA (n = 120), 500 µM BA (n = 120). Data are represented as mean ± SEM, n = sum length of neurites per neuron, *P < 0.05, **P < 0.01, ***P < 0.001, ns = not significant.

References

    1. Compston A, Coles A. Multiple sclerosis. Lancet. 2008;372(9648):1502–1517. - PubMed
    1. Dendrou CA, Fugger L, Friese MA. Immunopathology of multiple sclerosis. Nat Rev Immunol. 2015;15(9):545–558. - PubMed
    1. Friese MA, Schattling B, Fugger L. Mechanisms of neurodegeneration and axonal dysfunction in multiple sclerosis. Nat Rev Neurol. 2014;10(4):225–238. - PubMed
    1. Baecher-Allan C, Kaskow BJ, Weiner HL. Multiple sclerosis: Mechanisms and immunotherapy. Neuron. 2018;97(4):742–768. - PubMed
    1. Faissner S, Plemel JR, Gold R, Yong VW. Progressive multiple sclerosis: From pathophysiology to therapeutic strategies. Nat Rev Drug Discov. 2019;18(12):905–922. - PubMed

LinkOut - more resources