. 2024 Jun 4:15:1385582.
doi: 10.3389/fmicb.2024.1385582. eCollection 2024.

Identification of novel biomarkers for anti- Toxoplasma gondii IgM detection and the potential application in rapid diagnostic fluorescent tests

Affiliations

Identification of novel biomarkers for anti- Toxoplasma gondii IgM detection and the potential application in rapid diagnostic fluorescent tests

Minh-Ngoc Nguyen et al. Front Microbiol. .

Abstract

Toxoplasmosis, while often asymptomatic and prevalent as a foodborne disease, poses a considerable mortality risk for immunocompromised individuals during pregnancy. Point-of-care serological tests that detect specific IgG and IgM in patient sera are critical for disease management under limited resources. Despite many efforts to replace the T. gondii total lysate antigens (TLAs) by recombinant antigens (rAgs) in commercial kits, while IgG detection provides significant specificity and sensitivity, IgM detection remains comparatively low in sensitivity. In this study, we attempted to identify novel antigens targeting IgM in early infection, thereby establishing an IgM on-site detection kit. Using two-dimensional gel electrophoresis (2DE) and mouse serum immunoblotting, three novel antigens, including EF1γ, PGKI, and GAP50, were indicated to target T. gondii IgM. However, rAg EF1γ was undetectable by IgM of mice sera in Western blotting verification experiments, and ELISA coated with PGKI did not eliminate cross-reactivity, in contrast to GAP50. Subsequently, the lateral flow reaction employing a strip coated with 0.3 mg/mL purified rAg GAP50 and exhibited remarkable sensitivity compared with the conventional ELISA based on tachyzoite TLA, which successfully identified IgM in mouse sera infected with tachyzoites, ranging from 103 to 104 at 5 dpi and 104 at 7 dpi, respectively. Furthermore, by using standard T. gondii-infected human sera from WHO, the limit of detection (LOD) for the rapid fluorescence immunochromatographic test (FICT) using GAP50 was observed at 0.65 IU (international unit). These findings underline the particular immunoreactivity of GAP50, suggesting its potential as a specific biomarker for increasing the sensitivity of the FICT in IgM detection.

Keywords: 2DE immunoblotting; IgM detection; Toxoplasma gondii; diagnosis; fluorescence immunochromatographic test; point-of-care test.


Conflict of interest statement

The authors declare that the research was conducted in the absence of any commercial or financial relationships that could be construed as a potential conflict of interest.

Figures

Figure 1
Figure 1
Collection of sera from mice infected with T. gondii. (A) Scheme of the animal model: pure tachyzoites of T. gondii RH strain were intraperitoneally (i.p.) injected into the mouse belly, and blood was collected at 2–10 days post-infection. (B) TLA-based ELISA determination of IgM in the sera of BALB/c mice immunized with different number of tachyzoite. The ELISA data (each group n = 3) was shown as means ± SD. The dot-line indicated the cutoff value of ELISA which determined as mean of normal sera plus three times of SD. (C) Body weight change and (D) survival rate of infected mouse groups (each group n = 5) monitored every day. Two-way analysis of variance (ANOVA) was used to analyze the ELISA. ns, not statistically significant; *p < 0.05, **p < 0.01, ***p < 0.001, and ****p < 0.0001.
Figure 2
Figure 2
Two-dimension electrophoresis (2DE) and immunoblot analysis of tachyzoite total lysate antigen (TLA). 2DE of tachyzoites was conducted using IPG strip NL pH3-10 (A) and pH 5–8 (D) for analysis of the proteomics of T. gondii. Specific protein spots, indicated by red arrows, exhibited differential expression in tachyzoites compared with uninfected cells (Supplementary Figure S2). TLA proteins of tachyzoites (A,D) were transferred to a PVDF membrane and then normal sera (B,E) in comparison with T. gondii-infected mouse sera (C,F) diluted 1:100 were probed, followed by detection of anti-mouse IgM-HRP antibodies.
Figure 3
Figure 3
Predicted common linear epitopes and potential MHC-I and MHC-II binding peptide sequences. (A) EF1γ, (B) PGKI, and (C) GAP50 were analyzed and presented as 3D modeling. Red indicates common linear epitopes and purple and cyan indicate MHC I and II, respectively.
Figure 4
Figure 4
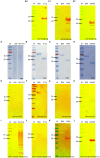
SDS-PAGE and Western blotting. (A) SDS-PAGE of T.gondii TLA in comparison with uninfected cell total lysate. Western blotting using anti-6× Hig-Tag to confirm the expression of the purified recombinant antigen (B,B1) EF1γ – 46 kDa; (C,C1) PGKI—48.5 kDa, and (D,D1) GAP50–50 kDa in comparison with BSA as the negative antigen. Western blotting to detect IgM antibodies probed by (E–H) normal mouse sera and (I–L) T. gondii 106 tachyzoite-infected mouse sera as the primary antibody of (E,I) of tachyzoites TLA in comparison with uninfected cells; (F,J) rAg EF1γ; (G,K) PGKI, and (H,L) GAP50 in comparison with BSA. Protein was run with 20 μg/lane. Anti-6× Hig-Tag mouse IgG-HRP was diluted 1:10,000 in 5% non-fat milk. Goat anti-mouse IgM (heavy chain)-HRP was diluted 1:3000 in 5% BSA. A total of 106T. gondii tachzyoites of RH strain-infected mouse sera collected on day 5 post-infection were used. M, Marker PageRuler Prestained Protein Ladder (#26617-Thermo Scientific).
Figure 5
Figure 5
Strip test diagram and an optimization coating strip. (A) Strip test diagram: The NC membrane was coated with 0.05 mg/mL of rabbit anti-goat IgG (H + L) as a control line (CL). The test line (TL) was coated with 0.3 mg/mL purified rAg T. gondii-GAP50 to detect IgM in patients with toxoplasmosis. The conjugate, sample, and absorbent pads were then attached to a backing card to complete the process. Overall, 6 μL of Eu NP-conjugated either with anti-mouse IgM or anti-human IgM was placed onto the conjugate pad. Then, a mixture of either mouse or human serum in 75 μL of distilled water (DW) was thoroughly diluted into 125 μL of diluent buffer and then applied to the sample pad. After 15–20 min, a portable fluorescent strip reader was used to interpret the results at excitation and emission wavelengths of 365 and 610 nm, respectively. The TL/CL ratio was used to calculate the quantitative diagnostic parameters of the FICT. (B,C) Optimization of the rAg concentration coating strip for the FICT to detect IgM in mouse and human sera. The NC membrane was coated with 0.1, 0.3, 0.5, or 1 mg/mL of purified rAg Tg-GAP50 as the TL. Mouse (B) and human sera (C) were analyzed by FICT using Eu-NP-conjugated anti-mouse IgM and/or anti-human IgM. The interaction of rAg with Abs present in sera was determined by measuring the fluorescence intensity (365 nm excitation and 610 nm emission). The rAg Tg-GAP50 coating was used to test cross-reactivity to P. vivax and P. yoelii. In total, 2 μL of serum was used per reaction. The TL fluorescent (n = 3) was shown as mean ± SD. Two-way analysis of variance (ANOVA) was used to analyze the FICT. ns: not statistically significant, *p < 0.05, **p < 0.01, ***p < 0.001, and ****p < 0.0001.
Figure 6
Figure 6
Evaluation of the quantity of conjugate required in each reaction of FICT to detect IgM. An immunochromatographic test strip included the test line (TL) coated with 0.3 mg/mL rAg Tg-GAP50 and the control line (CL) coated with 0.05 mg/mL rapid anti-goat IgG (anti-gIgG). EuNP-conjugated anti-mouse IgM (A,C,E) or conjugated anti-human IgM (B,D,F) was dropped onto the conjugate pad, and the strip was dipped in a mixture of sera for 15 min. A portable fluorescence detector (excitation at 365 nm and emission at 610 nm) was used to measure the fluorescence signals of TL (A,B) and CL (C,D). TL/CL values were used to determine the quantitative diagnostic value of the FICT (E,F). Overall, 2 μL of serum was used per reaction. The fluorescent density of TL, CL, and ratio of TL/CL data (n = 3) was shown as means ± SD. Two-way analysis of variance (ANOVA) was used to analyze the FICT. ns, not statistically significant; *p < 0.05, **p < 0.01, ***p < 0.001, and ****p < 0.0001.
Figure 7
Figure 7
Determination of the FICT threshold value for mouse serum using the TL/CL ratio. (A) Normal; P. yoelii sera (each group, n = 10) and T. gondii infected 106 tachyzoites at 5 dpi (n = 3) were shown with cutoff line. (B–G) T. gondii (101–106)-infected serum of BALB/c mice (each group, n = 3) at 2, 5, 7, and 10 dpi were subjected to the FICT. The cutoff value of the FICT was decided by calculating the mean of the normal sera (n = 10) plus three times the standard deviation (SD) using the TL/CL value when applying 2 μL of sera per strip reaction. Dotted line indicated that the cutoff value was 861.7 base on the TL/CL ratio. The ratio of TL/CL data was shown as means ± SD. Two-way analysis of variance (ANOVA) was used to analyze the FICT. ns, not statistically significant; *p < 0.05, **p < 0.01, ***p < 0.001, and ****p < 0.0001.
Figure 8
Figure 8
Determination of the FICT threshold value and Limit of Detection for human serum using the TL/CL ratio. (A) The cutoff value of FICT was decided by calculating the mean of normal human sera (n = 10) plus three times the standard deviation (SD) using the TL/CL value when applying 10 μL sera per strip reaction. Dotted line indicated that the cutoff value was 677.28 for distinguishing standard T. gondii-infected serum 13/132 (n = 1) with seronegative sera, P. vivax, and dengue sera (each group, n = 10). (B) T. gondii 13/132 were prepared by spiking in 10 μL of normal sera, which were then subjected to FICT. Thus, LOD for FICT using a coating of rAg Tg-GAP50 was established at 1.3 IU, equivalent to 4 μL tested. The ratio of TL/CL data was shown as means ± SD. Two-way analysis of variance (ANOVA) was used to analyze the ELISA and FICT. ns, not statistically significant; *p < 0.05, **p < 0.01, ***p < 0.001, and ****p < 0.0001.

Similar articles

Cited by

References

    1. Ajzenberg D., Yera H., Marty P., Paris L., Dalle F., Menotti J., et al. . (2009). Genotype of 88 toxoplasma gondii isolates associated with toxoplasmosis in immunocompromised patients and correlation with clinical findings. J. Infect. Dis. 199, 1155–1167. doi: 10.1086/597477, PMID: - DOI - PubMed
    1. Alvarado-Esquivel C., Niewiadomski A., Schweickert B., Liesenfeld O. (2011). Antiparasitic treatment suppresses production and avidity of toxoplasma gondii-specific antibodies in a murine model of acute infection*. Eur. J. Microbiol. Immunol. 1, 249–255. doi: 10.1556/EuJMI.1.2011.3.9, PMID: - DOI - PMC - PubMed
    1. Anand N., Lutshumba J., Whitlow M., Abdelaziz M. H., Mani R., Suzuki Y. (2022). Deficiency in indoleamine-2, 3-dioxygenase induces upregulation of guanylate binding protein 1 and inducible nitric oxide synthase expression in the brain during cerebral infection with toxoplasma gondii in genetically resistant BALB/c mice but not in genetically susceptible C57BL/6 mice. Microbes Infect. 24:104908. doi: 10.1016/j.micinf.2021.104908, PMID: - DOI - PMC - PubMed
    1. Anand N., Sehgal R., Kanwar R. K., Dubey M. L., Vasishta R. K., Kanwar J. R. (2015). Oral administration of encapsulated bovine lactoferrin protein nanocapsules against intracellular parasite toxoplasma gondii. Int. J. Nanomedicine 10, 6355–6369. doi: 10.2147/IJN.S85286, PMID: - DOI - PMC - PubMed
    1. Armbruster D. A., Pry T. (2008). Limit of blank, limit of detection and limit of quantitation. Clin. Biochem. Rev. 29, S49–S52, PMID: - PMC - PubMed

LinkOut - more resources