

Conservation tillage: a way to improve yield and soil properties and decrease global warming potential in spring wheat agroecosystems
- PMID: 38894971
- PMCID: PMC11183815
- DOI: 10.3389/fmicb.2024.1356426
Conservation tillage: a way to improve yield and soil properties and decrease global warming potential in spring wheat agroecosystems
Abstract
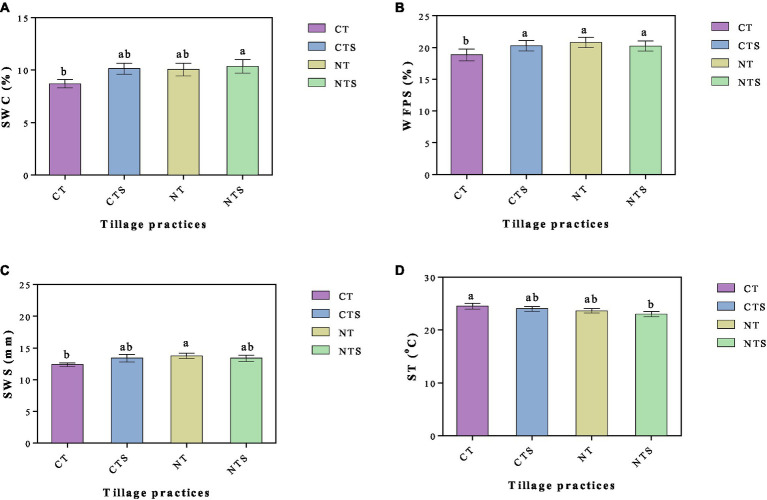
Climate change is one of the main challenges, and it poses a tough challenge to the agriculture industry globally. Additionally, greenhouse gas (GHG) emissions are the main contributor to climate change; however, croplands are a prominent source of GHG emissions. Yet this complex challenge can be mitigated through climate-smart agricultural practices. Conservation tillage is commonly known to preserve soil and mitigate environmental change by reducing GHG emissions. Nonetheless, there is still a paucity of information on the influences of conservation tillage on wheat yield, soil properties, and GHG flux, particularly in the semi-arid Dingxi belt. Hence, in order to fill this gap, different tillage systems, namely conventional tillage (CT) control, straw incorporation with conventional tillage (CTS), no-tillage (NT), and stubble return with no-tillage (NTS), were laid at Dingxi, Gansu province of China, under a randomized complete block design with three replications to examine their impacts on yield, soil properties, and GHG fluxes. Results depicted that different conservative tillage systems (CTS, NTS, and NT) significantly (p < 0.05) increased the plant height, number of spikes per plant, seed number per meter square, root yield, aboveground biomass yield, thousand-grain weight, grain yield, and dry matter yield compared with CT. Moreover, these conservation tillage systems notably improved the soil properties (soil gravimetric water content, water-filled pore space, water storage, porosity, aggregates, saturated hydraulic conductivity, organic carbon, light fraction organic carbon, carbon storage, microbial biomass carbon, total nitrogen, available nitrogen storage, microbial biomass nitrogen, total phosphorous, available phosphorous, total potassium, available potassium, microbial counts, urease, alkaline phosphatase, invertase, cellulase, and catalase) while decreasing the soil temperature and bulk density over CT. However, CTS, NTS, and NT had non-significant effects on ECe, pH, and stoichiometric properties (C:N ratio, C:P ratio, and N:P ratio). Additionally, conservation-based tillage regimes NTS, NT, and CTS significantly (p < 0.05) reduced the emission and net global warming potential of greenhouse gases (carbon dioxide, methane, and nitrous oxide) by 23.44, 19.57, and 16.54%, respectively, and decreased the greenhouse gas intensity by 23.20, 29.96, and 18.72%, respectively, over CT. We conclude that NTS is the best approach to increasing yield, soil and water conservation, resilience, and mitigation of agroecosystem capacity.
Keywords: carbon sequestration; climate-smart agriculture; global warming; greenhouse gases; nutrients; sustainable conservation tillage; yield.
Copyright © 2024 Sadiq, Rahim, Tahir, Alasmari, Alqahtani, Albogami, Ghanem, Abdein, Ali, Mehmood, Yuan, Shaheen, Shehzad, El-Sayed, Chen and Li.
Conflict of interest statement
The authors declare that the research was conducted in the absence of any commercial or financial relationships that could be construed as a potential conflict of interest.
Figures


References
-
- Alskaf K., Mooney S. J., Sparkes D. L., Wilson P., Sjogersten S. (2021). Short-term impacts of different tillage practices and plant residue retention on soil physical properties and greenhouse gas emissions. Soil Tillage Res. 206:104803. doi: 10.1016/j.still.2020.104803 - DOI
-
- Balota E. L., Colozzi Filho A., Andrade D. S., Dick R. P. (2004). Long-term tillage and crop rotation effects on microbial biomass and c and n mineralization in a Brazilian oxisol. Soil Tillage Res. 77, 137–145. doi: 10.1016/j.still.2003.12.003 - DOI
-
- Bayer C., Zschornack T., Pedroso G. M., da Rosa C. M., Camargo E. S., Boeni M., et al. (2015). A seven-year study on the effects of fall soil tillage on yield-scaled greenhouse gas emission from flood irrigated rice in a humid subtropical climate. Soil Tillage Res. 145, 118–125. doi: 10.1016/j.still.2014.09.001 - DOI
LinkOut - more resources
Full Text Sources
Research Materials
Miscellaneous