. 2024 Jun 4:12:1404894.
doi: 10.3389/fcell.2024.1404894. eCollection 2024.

Maturation of type I and type II rat vestibular hair cells in vivo and in vitro

Affiliations

Maturation of type I and type II rat vestibular hair cells in vivo and in vitro

Mireia Borrajo et al. Front Cell Dev Biol. .

Abstract

Vestibular sensory epithelia contain type I and type II sensory hair cells (HCI and HCII). Recent studies have revealed molecular markers for the identification of these cells, but the precise composition of each vestibular epithelium (saccule, utricle, lateral crista, anterior crista, posterior crista) and their postnatal maturation have not been described in detail. Moreover, in vitro methods to study this maturation are not well developed. We obtained total HCI and HCII counts in adult rats and studied the maturation of the epithelia from birth (P0) to postnatal day 28 (P28). Adult vestibular epithelia hair cells were found to comprise ∼65% HCI expressing osteopontin and PMCA2, ∼30% HCII expressing calretinin, and ∼4% HCII expressing SOX2 but neither osteopontin nor calretinin. At birth, immature HCs express both osteopontin and calretinin. P28 epithelia showed an almost adult-like composition but still contained 1.3% of immature HCs. In addition, we obtained free-floating 3D cultures of the epithelia at P1, which formed a fluid-filled cyst, and studied their survival and maturation in vitro up to day 28 (28 DIV). These cultures showed good HC resiliency and maturation. Using an enriched medium for the initial 4 days, a HCI/calretinin+-HCII ratio close to the in vivo ratio was obtained. These cultures are suitable to study HC maturation and mature HCs in pharmacological, toxicological and molecular research.

Keywords: 3D culture; SRY-box transcription factor 2 (SOX2); calretinin; contactin-associated protein 1 (CASPR1); osteopontin; plasma membrane calcium-transporting ATPase 2 (PMCA2); type I and type II hair cells; vestibular sensory hair cell.


Conflict of interest statement

The authors declare that the research was conducted in the absence of any commercial or financial relationships that could be construed as a potential conflict of interest. The author(s) declared that they were an editorial board member of Frontiers, at the time of submission. This had no impact on the peer review process and the final decision.

Figures

FIGURE 1
FIGURE 1
Hair cells (HC) in the vestibular saccule (A), utricle (B), anterior/posterior crista (C), and lateral crista (D) of the adult Long-Evans rat. Whole-mount epithelia were immunolabelled with antibodies against MYO7A (138-1-s, shown in red), osteopontin (AF808, shown in blue) and calretinin (214.104, shown in yellow), then imaged by tile scan in a confocal microscope. Shown here are maximum intensity projections from several non-consecutive optical planes, selected for display. The entire stack was used for HC counting. Scale bars = 100 μm. Note that the lateral crista in D is displayed at higher magnification than the epithelia in (A–C). Higher magnification images and separate colour channels are shown in Figure 2. (E). Total number of MYO7A + HCs in the saccule, utricle, anterior/posterior (A/P) crista, and lateral (Lat.) crista. Graph displays mean ± SEM and individual values. Epithelia were derived from three female (solid symbols) and one male (open symbols) animals. The A/P crista include anterior cristae (up-right triangles), posterior cristae (inverted triangles) and unidentified anterior/posterior cristae (diamonds).
FIGURE 2
FIGURE 2
Hair cell (HC) types in the vestibular epithelia of the adult Long-Evans rat as defined by the expression of molecular markers. Top. Confocal microscopy images showing the immunolabelling of an utricle with antibodies against osteopontin (AF808, (A), calretinin (214.104, (B), and MYO7A (138-s-1, (C). Panel (D) shows the overlap of the three markers. Scale bar = 50 μm. Arrows: type I HCs (HCI) expressing osteopontin but not calretinin. Arrowheads: type II HC (HCII) expressing calretinin but not osteopontin. Asterisks: MYO7A-only HCII, expressing neither osteopontin nor calretinin. Crosses: HCI expressing osteopontin encased by a calyx from a calyx-only afferent that expresses calretinin. Bottom. Counts of the HC types according to their expression of these markers in the saccule (E), utricle (F), anterior/posterior crista (G), and lateral crista (H). Bar graphs show mean number of HCs ± SE (n = 6 anterior/posterior crista; n = 3 other epithelia). Pie charts show the percentages of each cell type in the corresponding epithelium.
FIGURE 3
FIGURE 3
Specificity of the molecular markers for hair cell (HC) types in the vestibular epithelia of the adult Long-Evans rat. Images in top row: Confocal microscopy images illustrating the immunolabelling results. Graphs in bottom row: Quantitative analyses. (A) Arrow: HCs that express osteopontin (blue) are associated with calyces that express CASPR1 (red). Arrowhead: HCs that express calretinin (yellow) are not associated with CASPR1+ calyces. (B) Arrow: HCs that express MYO7A (red) but neither osteopontin (blue) nor calretinin (yellow) are not associated with a CASPR1+ calyx (green in the main panel). Asterisk: HCII expressing calretinin. Arrowhead: example of HCI with high expression of osteopontin above the nucleus (blue) and CASPR1+ calyx (green) encasing the basolateral part of the cell. (C) In the top half-pannel, arrows point to HCs (MYO7A+, red) that do not express neither osteopontin (blue) nor calretinin (yellow). In the bottom half-pannel, the same image is displayed with the green channel activated to show SOX2 label. Arrowheads: examples of HCI with MYO7A (red) and osteopontin (blue) label. Two HCII expressing intense (black asterisk) or weak (white asterisk) calretinin label are also positive for SOX2. (D) Arrow: Stereocilia labelled with the PMCA2 antibody (red) arise from HCs that express osteopontin (blue) and are surrounded by a CASPR1+ calyx (green). Arrowhead: Stereocilia of HCs expressing calretinin (yellow) do not express PMCA2. Scale bars: A, 10 μm; B-main, 30 μm; B-inset, C and D, 20 μm. (A′-D′) Quantitative analyses. Data in A′, B′ and D′ are the percentage of HCs showing the different possible combinations of markers in the HC or the associated calyx, as indicated on the abscissa. Each individual point is the percentage obtained in an individual vestibular epithelium (crista, utricle or saccule). Bars are mean values of these points. Data in C′ are absolute counts per epithelium of cells showing a MYO7A+/osteopontin-/calretinin-profile or the same profile plus SOX2 label. Data in A′ are from 10 epithelia from two different animals, those in B′ are from eight epithelia from two animals, those in C′ are from nine epithelia from three animals and those in D′ are from 14 epithelia from four animals. ns: Non-significant at p = 0.05, paired t-test.
FIGURE 4
FIGURE 4
Maturation of the vestibular sensory epithelia of Long-Evans rats from birth (P0) to postnatal day 28 (P28). Top (A–D; A′-D′). Confocal microscopy images showing utricles immunolabelled with antibodies against MYO7A+ (red), osteopontin (blue), and calretinin (yellow) at postnatal days 1, 7, 14, and 28. The first row shows the entire utricles. Higher magnification images of the boxed areas in the first row are shown in the second row. Scale bars: A-D, 100 μm; A′-D′, 30 μm. Bottom. Quantitative analyses. (E). The graph displays the mean (±SE, when larger than point size) numbers of cells of each immunolabelling type at each time point in the utricle (n = 3/time point). Replicates are from three different rats from at least 2 litters from different progenitors, except at day 10, at which all rats were siblings. The data from adult rats, already shown in Figure 2.F, are included for comparison. n.s.: No statistically significant difference between P28 and P60 data. **: Statistically significant difference (p < 0.01) between P28 and P60 in the number of immature HCs expressing both osteopontin and calretinin. (F): Bars show the percent distribution of HCs at each postnatal day in the utricle (data derived from data in panel I), and at P1 and P14 in the saccule and the lateral crista. From top to bottom, the sectors show the percentage of HCs expressing neither osteopontin nor calretinin (MYO7A-only, about 10%–15% of the HCII in adult rats), calretinin (85%–90% of the HCII in adult rats), osteopontin (HCI), and both osteopontin and calretinin (immature HCs).
FIGURE 5
FIGURE 5
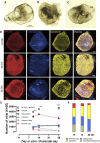
3D culture and maturation of vestibular sensory epithelia of the rat. Cristae, utricles and saccules were obtained at postnatal day 1 (P1) and cultured free floating in standard culture medium for up to 27 additional days (28DIV). (A–C). Aspect of the crista, utricle and saccule, respectively, at 14 DIV. Note that each sensory epithelium is included in a cyst with a non-sensory epithelium enclosing a fluid-filled cavity. (D). Confocal microscopy images of utricles collected at 10, 14 or 28 DIV and immunolabelled for MYO7A (red, first column), osteopontin (blue, second column), and calretinin (yellow, third column). Overlay images are shown in the fourth column. Scale bars: 100 μm. (E, F). Quantitative analysis. (E). Number (mean ± SE, when larger than point size) of each hair cell (HC) type in these utricles (n = 3/time point). The total number of HCs (MYO7A+) in utricles grown in vivo, as reported in Figure 4, are included for comparison purposes. **: p < 0.01, ***, p < 0.001, in vivo vs. in vitro total HCs. (F). Percent distribution of HCs at 10, 14 and 28 DIV. From top to bottom, the sectors show the percentage of HCs expressing neither osteopontin nor calretinin (MYO7A-only, about 10%–15% of the HCII in adult rats), calretinin (85%–90% of the HCII in adult rats), osteopontin (HCI), and both osteopontin and calretinin (immature HCs).
FIGURE 6
FIGURE 6
Effect of culture conditions on HC survival and differentiation in 3D cultures of rat vestibular sensory epithelia. Utricles were obtained at postnatal day 1 (P1) and cultured free floating for up to 27 additional days (28DIV). (A–L). Utricles cultured until 28DIV, then immunolabelled for MYO7A (A, E, I, red), osteopontin (B, F, J, blue), and calretinin (C, G, K, yellow). Overlay images are shown in D, H, L. (A–D). Utricle cultured in standard medium until 28DIV; note the high density of HCs. (E–H). Utricle cultured under slow orbital rocking in a modified medium containing 1% matrigel, 1% B27 and 50 ng/mL EGF until 28DIV. Note the reduced density of HCs. (I–L). Utricle cultured with an enriched medium (containing EGF, FGF2, FGF10, N-acetyl-L-cistein, nicotinamide and insulin-transferrin-selenin-etanolamine supplement) for 4 days and then in standard medium until 28DIV. Note the high density of HCs and the reduced density of calretinin + HCs. A′-D′ and I′-L’. Higher magnification of the boxed areas of utricles in (A–D) and (I–L). Scale bars: 100 mm in A-L, 30 mm in A′-L’. (M, N). Comparison of total HC numbers (M) and percentage of HC types according to expression of the molecular markers (L) between standard culture conditions (−) and modified culture conditions (M, F, R and their combinations). The modifications were applied from days 1–28 or from days 1–14 only, and the specimens were in both cases collected at 28DIV. The modifications were applied alone or in combination and consisted of 1% matrigel (M), 1% B27 plus 50 ng/mL EGF (F), and slow orbital rocking (R). Data are mean + SEM (n = 3/condition). ***: p < 0.001, different from standard culture conditions (Tukey’s test after significant ANOVA). (O). Comparison of the percentages of HC types between utricles grown in vivo (P28), cultured in standard culture conditions (28DIV Std) and cultured for 4 days in the enriched medium and then in the standard medium until day 28 as described above. *, ns: p < 0.05 or non-significant, respectively, in comparison to in vivo data. #: p < 0.01, different from standard culture conditions. Tukey’s test after significant ANOVA.
FIGURE 7
FIGURE 7
Composition of the vestibular sensory epithelia of the adult rat. Around 65% of the HCs are HCI expressing PCMA2 in the stereocilia and osteopontin in the cytoplasm, more concentrated in the neck to supranuclear zone. They are in contact with calyx afferents expressing CASPR1. The remaining HCs are HCII that express SOX2 in the nucleus. These include 85%–90% HCII expressing calretinin and 10%–15% HCII that do not express calretinin.

References

    1. Bartolami S., Gaboyard S., Quentin J., Travo C., Cavalier M., Barhanin J., et al. (2011). Critical roles of transitional cells and Na/K-ATPase in the formation of vestibular endolymph. J. Neurosci. 31 (46), 16541–16549. 10.1523/JNEUROSCI.2430-11.2011 - DOI - PMC - PubMed
    1. Brugeaud A., Travo C., Demêmes D., Lenoir M., Llorens J., Puel J. L., et al. (2007). Control of hair cell excitability by vestibular primary sensory neurons. J. Neurosci. 27 (13), 3503–3511. 10.1523/JNEUROSCI.5185-06.2007 - DOI - PMC - PubMed
    1. Burns J. C., On D., Baker W., Collado M. S., Corwin J. T. (2012). Over half the hair cells in the mouse utricle first appear after birth, with significant numbers originating from early postnatal mitotic production in peripheral and striolar growth zones. J. Assoc. Res. Otolaryngology JARO 13 (5), 609–627. 10.1007/s10162-012-0337-0 - DOI - PMC - PubMed
    1. Cunningham L. L. (2006). The adult mouse utricle as an in vitro preparation for studies of ototoxic-drug-induced sensory hair cell death. Brain Res. 1091 (1), 277–281. 10.1016/j.brainres.2006.01.128 - DOI - PMC - PubMed
    1. Cunningham L. L., Cheng A. G., Rubel E. W. (2002). Caspase activation in hair cells of the mouse utricle exposed to neomycin. J. Neurosci. 22 (19), 8532–8540. 10.1523/JNEUROSCI.22-19-08532.2002 - DOI - PMC - PubMed