

The relationship between refractive error and the risk of diabetic retinopathy: a systematic review and meta-analysis
- PMID: 38895184
- PMCID: PMC11183799
- DOI: 10.3389/fmed.2024.1354856
The relationship between refractive error and the risk of diabetic retinopathy: a systematic review and meta-analysis
Abstract
Purpose: This meta-analysis was conducted to collect all available data and estimate the relationship between refractive error and the risk of diabetic retinopathy (DR) in patients with diabetes, and to assess whether vision-threatening DR (VTDR) is associated with refractive error.
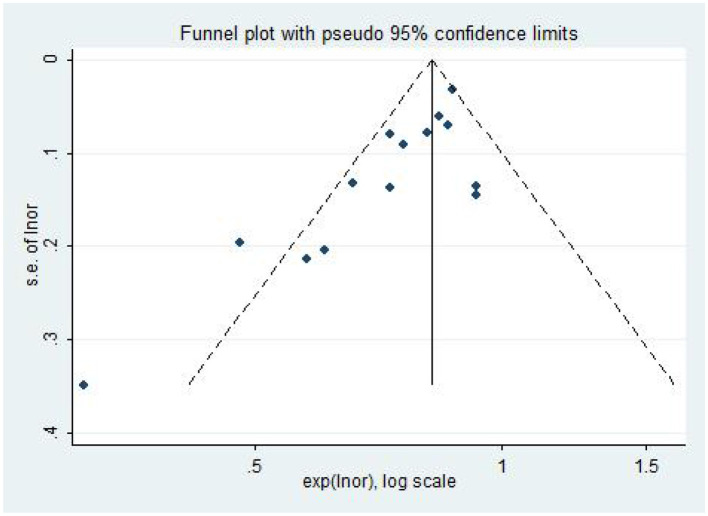
Methods: We systematically searched several literature databases including PubMed, Embase, Cochrane Library, Web of Science, CNKI, CBM, Wan Fang Data, and VIP databases. Pooled odds ratios (OR) and 95% confidence intervals (CI) were calculated using fixed or random effects models. Four models were developed to assess the relationship between refractive error and the risk and DR, VTDR: hyperopia and DR, VTDR; myopia and DR, VTDR; spherical equivalent (SE per D increase) and DR, VTDR; and axial length (AL per mm increase) and DR, VTDR. The included literature was meta-analyzed using Stata 12.0 software, and sensitivity analysis was performed. Publication bias in the literature was evaluated using a funnel plot, Begg's test, and Egger's test.
Results: A systematic search identified 3,198 articles, of which 21 (4 cohorts, 17 cross-sectional studies) were included in the meta-analysis. Meta-analysis showed that hyperopia was associated with an increased risk of VTDR (OR: 1.23; 95% CI: 1.08-1.39; P = 0.001), but not with DR (OR: 1.05; 95% CI: 0.94-1.17; P = 0.374). Myopia was associated with a reduced risk of DR (OR: 0.74; 95% CI: 0.61-0.90; P = 0.003), but not with VTDR (OR: 1.08; 95% CI: 0.85-1.38; P = 0.519). Every 1 diopter increase in spherical equivalent, there was a 1.08 increase in the odds ratio of DR (OR: 1.08; 95% CI: 1.05-1.10; P<0.001), but not with VTDR (OR: 1.05; 95% CI: 1.00-1.10; P = 0.06). AL per mm increase was significantly associated with a decreased risk of developing DR (OR: 0.77; 95% CI: 0.71-0.84; P<0.001) and VTDR (OR: 0.63; 95% CI: 0.56-0.72; P<0.001). Analysis of sensitivity confirmed the reliability of the study's findings.
Conclusion: This meta-analysis demonstrates hyperopia was associated with an increased risk of VTDR in diabetes patients. Myopia was associated with a reduced risk of DR. AL is an important influencing factor of refractive error. Every 1 mm increase in AL reduces the risk of DR by 23% and the risk of VTDR by 37%.
Systematic review registration: identifier: CRD42023413420.
Keywords: axial length; diabetic retinopathy; hyperopia; meta-analysis; myopia; refractive error.
Copyright © 2024 Li, Hu, Li, Wu, Wang and Peng.
Conflict of interest statement
The authors declare that the research was conducted in the absence of any commercial or financial relationships that could be construed as a potential conflict of interest.
Figures


Similar articles
-
Myopia and/or longer axial length are protective against diabetic retinopathy: a meta-analysis.Acta Ophthalmol. 2016 Jun;94(4):346-52. doi: 10.1111/aos.12908. Epub 2015 Nov 7. Acta Ophthalmol. 2016. PMID: 26547796 Review.
-
Association between ocular biometrical parameters and diabetic retinopathy in Chinese adults with type 2 diabetes mellitus.Acta Ophthalmol. 2021 Aug;99(5):e661-e668. doi: 10.1111/aos.14671. Epub 2020 Nov 16. Acta Ophthalmol. 2021. PMID: 33191663
-
Does myopia decrease the risk of diabetic retinopathy in both type-1 and type-2 diabetes mellitus?Indian J Ophthalmol. 2021 Nov;69(11):3178-3183. doi: 10.4103/ijo.IJO_1403_21. Indian J Ophthalmol. 2021. PMID: 34708767 Free PMC article.
-
Are myopic eyes less likely to have diabetic retinopathy?Ophthalmology. 2010 Mar;117(3):524-30. doi: 10.1016/j.ophtha.2009.07.044. Epub 2010 Jan 19. Ophthalmology. 2010. PMID: 20031224
-
Prevalence of visual impairment due to refractive error among children and adolescents in Ethiopia: A systematic review and meta-analysis.PLoS One. 2022 Aug 18;17(8):e0271313. doi: 10.1371/journal.pone.0271313. eCollection 2022. PLoS One. 2022. PMID: 35980970 Free PMC article.
Cited by
-
A study of association of ocular biometric parameters with various grades of diabetic macular edema and severity of diabetic retinopathy.J Family Med Prim Care. 2025 May;14(5):1980-1984. doi: 10.4103/jfmpc.jfmpc_1919_24. Epub 2025 May 31. J Family Med Prim Care. 2025. PMID: 40547718 Free PMC article.
References
-
- GBD 2019 Blindness and Vision Impairment Collaborators; Vision Loss Expert Group of the Global Burden of Disease Study . Causes of blindness and vision impairment in 2020 and trends over 30 years, and prevalence of avoidable blindness in relation to VISION 2020: the Right to Sight: an analysis for the Global Burden of Disease Study. Lancet Glob Health. (2021) 9:e144–e160. 10.1016/S2214-109X(20)30489-7 - DOI - PMC - PubMed
Publication types
LinkOut - more resources
Full Text Sources