[Preprint]. 2024 Jun 8:2024.06.06.597793.
doi: 10.1101/2024.06.06.597793.

Diet-microbiome interactions promote enteric nervous system resilience following spinal cord injury

Affiliations

Diet-microbiome interactions promote enteric nervous system resilience following spinal cord injury

Adam M Hamilton et al. bioRxiv. .

Update in

Abstract

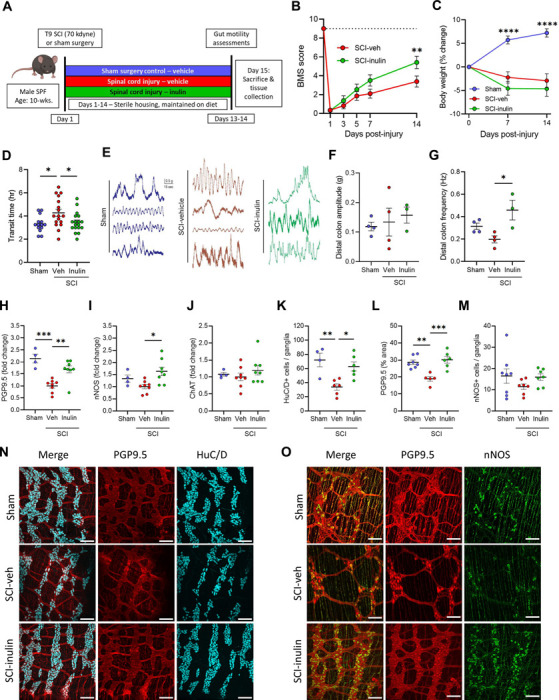
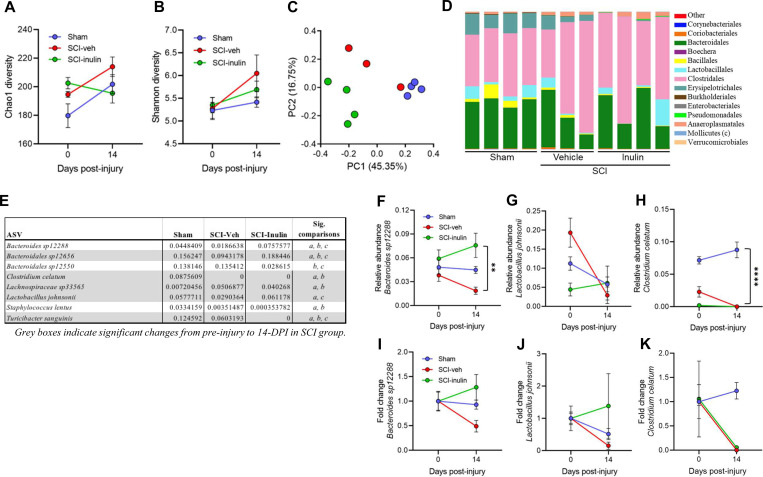
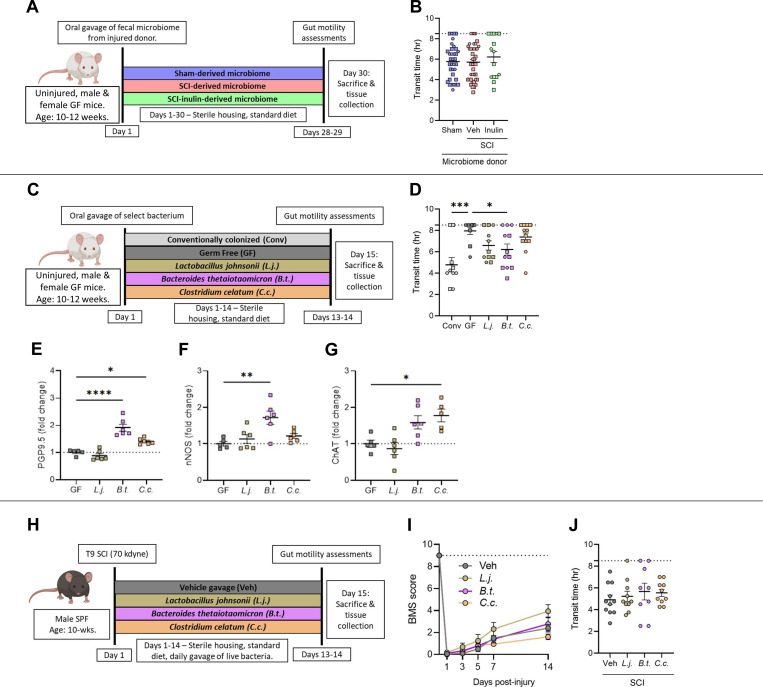
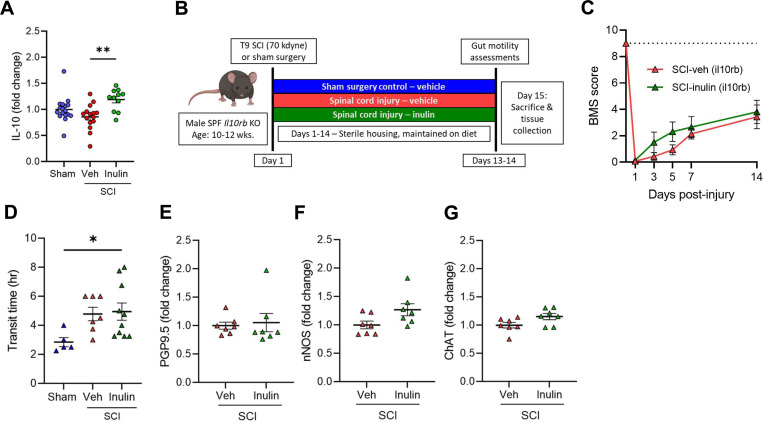
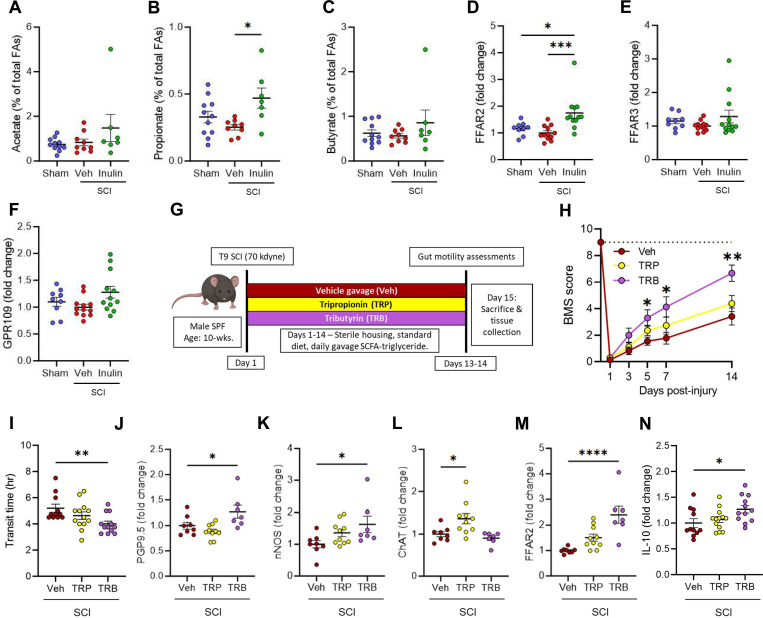
Spinal cord injury (SCI) results in a plethora of physiological dysfunctions across all body systems, including intestinal dysmotility and atrophy of the enteric nervous system (ENS). Typically, the ENS has capacity to recover from perturbation, so it is unclear why intestinal pathophysiologies persist after traumatic spinal injury. With emerging evidence demonstrating SCI-induced alterations to the gut microbiome composition, we hypothesized that modulation of the gut microbiome could contribute to enteric nervous system recovery after injury. Here, we show that intervention with the dietary fiber, inulin prevents ENS atrophy and limits SCI-induced intestinal dysmotility in mice. However, SCI-associated microbiomes and exposure to specific SCI-sensitive gut microbes are not sufficient to modulate injury-induced intestinal dysmotility. Intervention with microbially-derived short-chain fatty acid (SCFA) metabolites prevents ENS dysfunctions and phenocopies inulin treatment in injured mice, implicating these microbiome metabolites in protection of the ENS. Notably, inulin-mediated resilience is dependent on signaling by the cytokine IL-10, highlighting a critical diet-microbiome-immune axis that promotes ENS resilience following SCI. Overall, we demonstrate that diet and microbially-derived signals distinctly impact recovery of the ENS after traumatic spinal injury. This protective diet-microbiome-immune axis may represent a foundation to uncover etiological mechanisms and future therapeutics for SCI-induced neurogenic bowel.


Conflict of interest statement

Declaration of Interests: The authors declare no competing interests

Figures

Figure 1.
Figure 1.. Dietary inulin rescues SCI-induced enteric neuropathy and neurogenic bowel
A, Experimental overview: male wild-type mice receive T9 laminectomy (Sham) or laminectomy with 70kilodyne contusive spinal cord injury (SCI), with either a standard diet (Veh) or inulin (Inulin). B, Hindlimb locomotor score, as assessed by Basso mouse scale (BMS), with dashed line at 9 representing no deficits, indicative or sham or uninjured locomotor function. C, Percent changes in body weight relative to pre-injury weight. D, Quantification of total intestinal transit time. E, Representative traces of ex vivo colonic contractility. F-G, Average amplitude (F) and frequency (G) recorded from distal colon. H-J, Colonic protein levels measured via western blot for protein gene product 9.5 (PGP9.5) (H), neuronal nitric oxide synthase (nNOS) (I), and choline acetyltransferase (ChAT) (J). K-M, IF quantification showing the number of HuC/D+ cells per ganglia (K), percentage of PGP9.5+ area (L), and nNOS+ cells per ganglia (M). N, O, Representative images of myenteric plexus where cyan=HuC/D, red=PGP9.5, and green=nNOS. Asterisks in (C) indicate differences between sham and both SCI groups. Each circle represents individuals excluding (B, C), where each circle is the mean within that experimental group. IF data points are the averaged values of 2–7 images per mouse with N=4–8 mice per group. N=11–14 (B), N=18–19 (C), N=14–18 (D), N=3–4 (F, G), N=4–8 (H-J), N=4–8 (K-M). * P < 0.05, ** P < 0.01, *** P < 0.001, **** P < 0.0001. Data are shown as mean ± SEM and compared by repeated measures 2-way ANOVA with post-hoc Tukey’s test (for B, C) and by one-way ANOVA with post-hoc Tukey’s test (for D, F-M). Dashed line in (B) indicates maximum possible score for BMS of 9.
Figure 2.
Figure 2.. SCI-triggered dysbiosis is prevented by inulin
A, B, Pre-surgery to 14-dpi changes in fecal microbiome in male mice. Chao1(A) and Shannon (B) alpha diversity measures. C, Bray-Curtis principal component analysis (PCA) plot. D, Order level microbiome composition plot at 14-dpi. E, Table highlighting the mean relative abundance of bacterial taxa that differ between experimental groups at 1% FDR, where grey boxes indicate significant changes from pre-injury to 14-dpi in SCI-veh group, and “a, b, & c” indicate significant differences between groups at endpoint. F-K, Progressive changes in select taxa represented as relative abundance (F-H) and as proportion of pre-injury abundance (I-K) for Bacteroides sp12288 (F, I), Lactobacillus johnsonii (G, J), and Clostridium celatum (H, K). Asterisks in (F) indicate significant difference between SCI-veh and SCI-inulin groups at 14-dpi. Asterisks in (H) indicate significant difference between sham and both SCI groups. Each circle represents within group mean, excluding C, where each circle represents individuals. N=3–4. ** P < 0.01, **** P < 0.0001. Data are shown as mean ± SEM and compared by repeated measures 2-way ANOVA with post-hoc Sidak’s test (A, B) or Tukey’s test (F-K) and by 1% FDR (for E).
Figure 3.
Figure 3.. Post-injury and diet-induced microbes differentially impact the ENS
A, Experimental overview: male and female, uninjured, wild-type, germ-free mice received fecal microbiomes of donors with laminectomy (sham), SCI (veh) or SCI with inulin (inulin). B, Quantification of total intestinal transit time. C, Experimental overview: male and female, uninjured, wild-type, germ-free mice are mono-colonized with Lactobacillus johnsonii (L.j.), Bacteroides thetaiotaomicron (B.t.), or Clostridium celatum (C.c.), alongside conventionally colonized (Conv) and germ-free (GF) controls. D, intestinal transit time at experimental endpoint. E-G, Quantification of proximal colon, from male mice, by western blots for protein gene product 9.5 (PGP9.5) (E), neuronal nitric oxide synthase (nNOS) (F), and choline acetyltransferase (ChAT) (G). H, Experimental overview: male, wild-type mice received laminectomy with 70kilodyne contusive spinal cord injury (SCI), followed by daily oral gavage of L.j., B.t., C.c., or vehicle (veh). I, Progressive Basso mouse scale (BMS) scores of mice provided daily probiotic gavage of veh, L.j., B.t., or C.c., with dashed line at 9 representing uninjured locomotor function. . J, Endpoint intestinal transit time. Each point represents individuals for all but (I), where each circle is the average of all mice within that experimental group. (A-D) Squares represent males, hexagons represent females. N=15–41 (B), N=10–12 (D), N=5–6 (E-G), N=9–11 (I-J). * P < 0.05, ** P < 0.01, *** P < 0.001, **** P < 0.0001. Data are shown as mean ± SEM and compared by ordinary one-way ANOVA with post-hoc Tukey’s (B) or Dunnett’s (D-G, J) tests. Dashed line in (I) indicates maximum possible score for BMS of 9.
Figure 4.
Figure 4.. IL-10 signaling is necessary for inulin-mediated resilience to NBD
A, Concentration of colonic IL-10 by ELISA from male mice with laminectomy (sham), SCI (veh), or SCI with inulin-supplemented diet (inulin). B, Experimental overview: male IL10rb KO mice undergo laminectomy at T9 (Sham) or laminectomy with 70kilodyne contusive spinal cord injury (SCI) and receive either standard diet (Veh) or inulin (Inulin). C, Progressive Basso mouse scale (BMS) scores with dashed line at 9 representing uninjured locomotor function. D, intestinal transit time at endpoint. E-G, Quantification of colonic protein gene product 9.5 (PGP9.5) (E), neuronal nitric oxide synthase (nNOS) (F), and choline acetyltransferase (ChAT) (G) by western blot. Each point represents individuals for all but (C), where each circle is the average of all mice within that experimental group. N=11–17 (A), N= 5–10 (C-G) * P < 0.05, ** P < 0.01. Data are shown as mean ± SEM and compared by ordinary one-way ANOVA with post-hoc Tukey’s (A, D), 2-way ANOVA (C) or two-tailed unpaired t-test (E-G). Dashed line in (C) indicates maximum possible score for BMS of 9.
Figure 5.
Figure 5.. Intestinal SCFA signaling is impacted post-SCI and promotes rescue of NBD
A-C, Quantification of indicated short-chain fatty-acids at endpoint fecal pellets from male mice with sham laminectomy (sham), or with SCI (SCI-veh) or inulin-supplemented diet (SCI-inulin). D-F, Quantification of colonic free fatty acid receptor 2 (FFAR2) (D), free fatty acid receptor 3 (FFAR3) (E), and G-protein-coupled receptor 109 (GPR109) (F) by western blot. G, Experimental overview: male wild-type mice receive laminectomy with 70kilodyne contusive spinal cord injury (SCI) followed by daily gavage of vehicle (veh), tripropionin (TRP), or tributyrin (TRB). H, Progressive Basso mouse scale (BMS) scores, with dashed line at 9 uninjured locomotor function. I, intestinal transit time at experimental endpoint. J-M, Quantification of colonic protein gene product 9.5 (PGP9.5) (J), neuronal nitric oxide synthase (nNOS) (K), choline acetyltransferase (ChAT) (L), and free fatty acid 2 (FFAR2) (M) by western blot. N, Concentration of serum IL-10 by ELISA. Each point represents individuals for all but (H), where each circle is the average of all mice within that experimental group. N=7–11 (A-C), N=9–12 (D-F), N=11–13 (H, I, N), N=7–10 (J-M). * P < 0.05, ** P < 0.01, *** P < 0.001, **** P < 0.0001. Data are shown as mean ± SEM and compared by ordinary one-way ANOVA with post-hoc Tukey’s (A-F) or Dunnett’s (I-N) tests, and by 2-way ANOVA with post-hoc Dunnett’s multiple comparison test (H). Dashed line in (H) indicates maximum possible score for BMS of 9.

References

    1. Ahuja C. S. et al. Traumatic spinal cord injury. Nat Rev Dis Primers 3, 17018, doi:10.1038/nrdp.2017.18 (2017). - DOI - PubMed
    1. Alizadeh A., Dyck S. M. & Karimi-Abdolrezaee S. Traumatic Spinal Cord Injury: An Overview of Pathophysiology, Models and Acute Injury Mechanisms. Front Neurol 10, 282, doi:10.3389/fneur.2019.00282 (2019). - DOI - PMC - PubMed
    1. Hakim S., Gaglani T. & Cash B. D. Neurogenic Bowel Dysfunction: The Impact of the Central Nervous System in Constipation and Fecal Incontinence. Gastroenterol Clin North Am 51, 93–105, doi:10.1016/j.gtc.2021.10.006 (2022). - DOI - PubMed
    1. Stiens S. A., Bergman S. B. & Goetz L. L. Neurogenic bowel dysfunction after spinal cord injury: clinical evaluation and rehabilitative management. Arch Phys Med Rehabil 78, S86–102, doi:10.1016/s0003-9993(97)90416-0 (1997). - DOI - PubMed
    1. Simpson L. A., Eng J. J., Hsieh J. T., Wolfe D. L. & Spinal Cord Injury Rehabilitation Evidence Scire Research, T. The health and life priorities of individuals with spinal cord injury: a systematic review. J Neurotrauma 29, 1548–1555, doi:10.1089/neu.2011.2226 (2012). - DOI - PMC - PubMed

Publication types