

This is a preprint.
Unraveling Alzheimer's Disease: Investigating Dynamic Functional Connectivity in the Default Mode Network through DCC-GARCH Modeling
- PMID: 38895209
- PMCID: PMC11185527
- DOI: 10.1101/2024.06.02.597071
Unraveling Alzheimer's Disease: Investigating Dynamic Functional Connectivity in the Default Mode Network through DCC-GARCH Modeling
Abstract
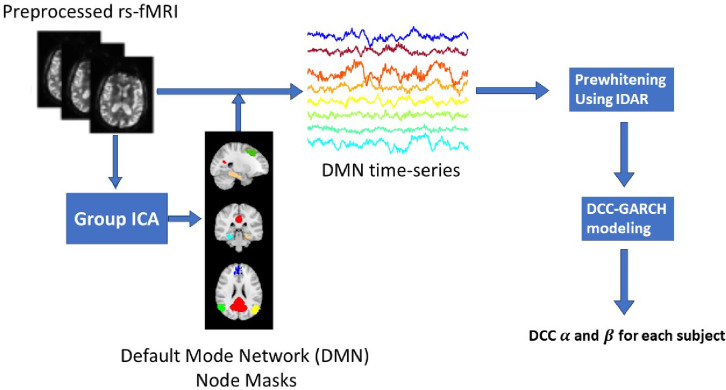
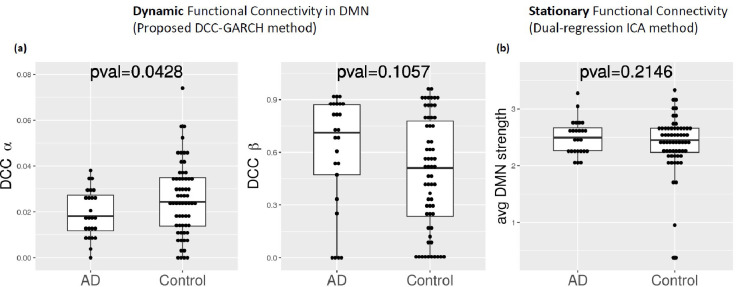
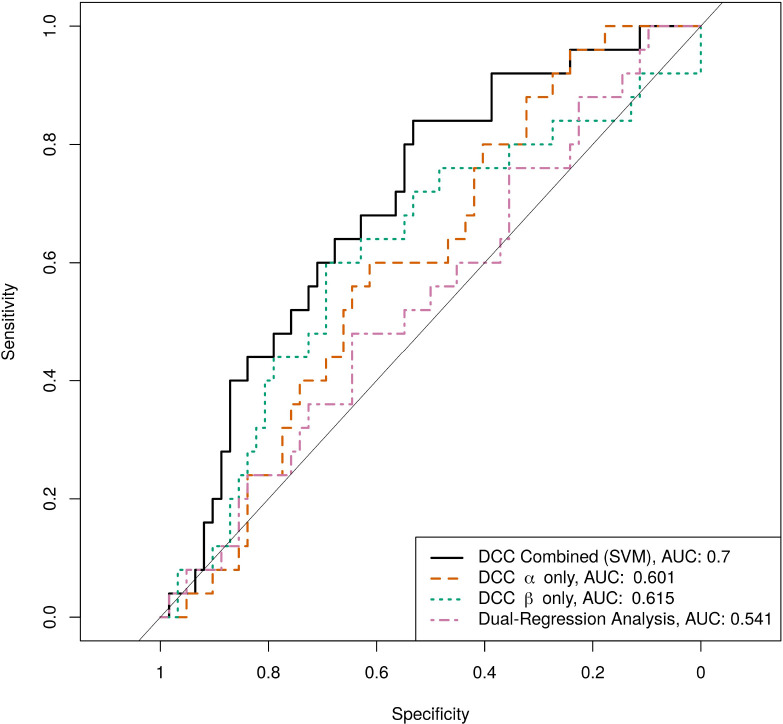
Alzheimer's disease (AD) has a prolonged latent phase. Sensitive biomarkers of amyloid beta ( ), in the absence of clinical symptoms, offer opportunities for early detection and identification of patients at risk. Current biomarkers, such as CSF and PET biomarkers, are effective but face practical limitations due to high cost and limited availability. Recent blood plasma biomarkers, though accessible, still incur high costs and lack physiological significance in the Alzheimer's process. This study explores the potential of brain functional connectivity (FC) alterations associated with AD pathology as a non-invasive avenue for detection. While current stationary FC measurements lack sensitivity at the single-subject level, our investigation focuses on dynamic FC using resting-state functional MRI (rs-fMRI) and introduces the Generalized Auto-Regressive Conditional Heteroscedastic Dynamic Conditional Correlation (DCC-GARCH) model. Our findings demonstrate the superior sensitivity of DCC-GARCH to CSF status, and offer key insights into dynamic functional connectivity analysis in AD.
Keywords: Alzheimer’s Disease; Amyloid Beta Biomarker; Default Mode Network; Dynamic Brain Functional Connectivity; Resting-state fMRI.
Figures
Similar articles
-
Alzheimer's Disease Biomarkers in Idiopathic Normal Pressure Hydrocephalus: Linking Functional Connectivity and Clinical Outcome.J Alzheimers Dis. 2021;83(4):1717-1728. doi: 10.3233/JAD-210534. J Alzheimers Dis. 2021. PMID: 34459399
-
A whole-brain computational modeling approach to explain the alterations in resting-state functional connectivity during progression of Alzheimer's disease.Neuroimage Clin. 2017 Aug 8;16:343-354. doi: 10.1016/j.nicl.2017.08.006. eCollection 2017. Neuroimage Clin. 2017. PMID: 28861336 Free PMC article.
-
Amyloid-driven disruption of default mode network connectivity in cognitively healthy individuals.Brain Commun. 2021 Sep 6;3(4):fcab201. doi: 10.1093/braincomms/fcab201. eCollection 2021. Brain Commun. 2021. PMID: 34617016 Free PMC article.
-
Understanding disease progression and improving Alzheimer's disease clinical trials: Recent highlights from the Alzheimer's Disease Neuroimaging Initiative.Alzheimers Dement. 2019 Jan;15(1):106-152. doi: 10.1016/j.jalz.2018.08.005. Epub 2018 Oct 13. Alzheimers Dement. 2019. PMID: 30321505 Review.
-
Diagnostic power of resting-state fMRI for detection of network connectivity in Alzheimer's disease and mild cognitive impairment: A systematic review.Hum Brain Mapp. 2021 Jun 15;42(9):2941-2968. doi: 10.1002/hbm.25369. Epub 2021 May 4. Hum Brain Mapp. 2021. PMID: 33942449 Free PMC article.
References
-
- Jack Clifford R Jr, Bennett David A, Blennow Kaj, Carrillo Maria C, Dunn Billy, Haeberlein Samantha Budd, Holtzman David M, Jagust William, Jessen Frank, Karlawish Jason, et al. Nia-aa research framework: toward a biological definition of alzheimer’s disease. Alzheimer’s & Dementia, 14(4):535–562, 2018. - PMC - PubMed
-
- Baldeiras Inês, Santana Isabel, Leitão Maria João, Ribeiro Maria Helena, Pascoal Rui, Duro Diana, Lemos Raquel, Santiago Beatriz, Almeida Maria Rosário, and Oliveira Catarina Resende . Cerebrospinal fluid aβ40 is similarly reduced in patients with frontotemporal lobar degeneration and alzheimer’s disease. Journal of the neurological sciences, 358(1–2):308–316, 2015. - PubMed
-
- Lewczuk Piotr, Lelental Natalia, Spitzer Philipp, Maler Juan Manuel, and Kornhuber Johannes. Amyloid-β 42/40 cerebrospinal fluid concentration ratio in the diagnostics of alzheimer’s disease: validation of two novel assays. Journal of Alzheimer’s disease, 43(1):183–191, 2015. - PubMed
-
- Lewczuk Piotr, Esselmann Hermann, Otto Markus, Maler Juan Manuel, Henkel Andreas Wolfram, Henkel Maria Kerstin, Eikenberg Oliver, Antz Christof, Krause Wolf-Rainer, Reulbach Udo, et al. Neurochemical diagnosis of alzheimer’s dementia by csf aβ42, aβ42/aβ40 ratio and total tau. Neurobiology of aging, 25(3):273–281, 2004. - PubMed
Publication types
Grants and funding
LinkOut - more resources
Full Text Sources