

This is a preprint.
Transcription factor binding site divergence across maize inbred lines drives transcriptional and phenotypic variation
- PMID: 38895211
- PMCID: PMC11185568
- DOI: 10.1101/2024.05.31.596834
Transcription factor binding site divergence across maize inbred lines drives transcriptional and phenotypic variation
Update in
-
Transcription factor binding divergence drives transcriptional and phenotypic variation in maize.Nat Plants. 2025 Jun;11(6):1205-1219. doi: 10.1038/s41477-025-02007-8. Epub 2025 Jun 12. Nat Plants. 2025. PMID: 40506505
Abstract
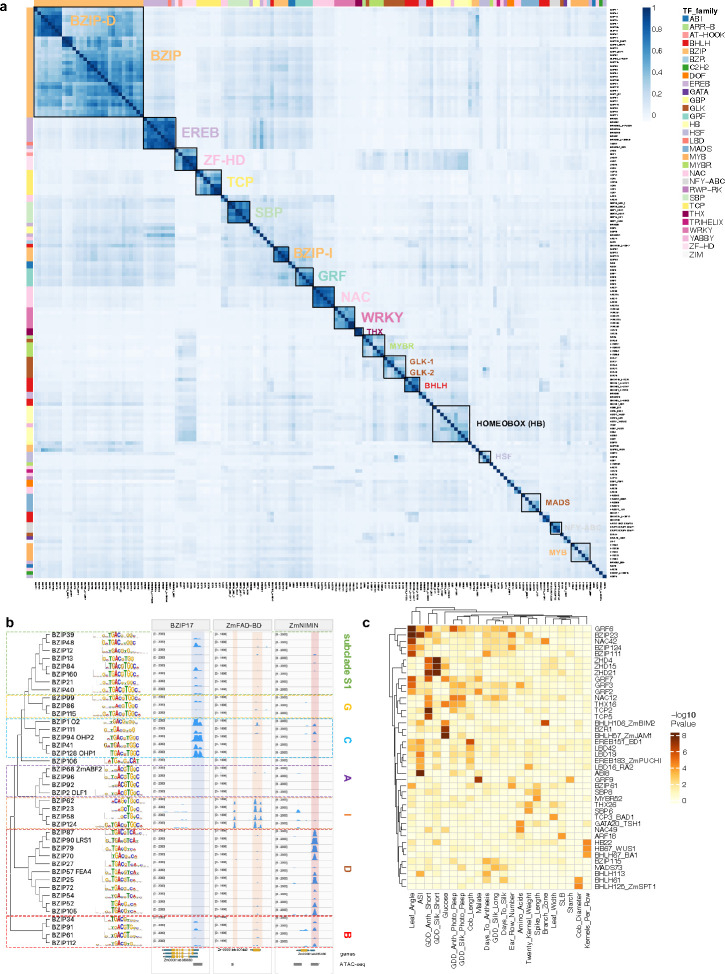
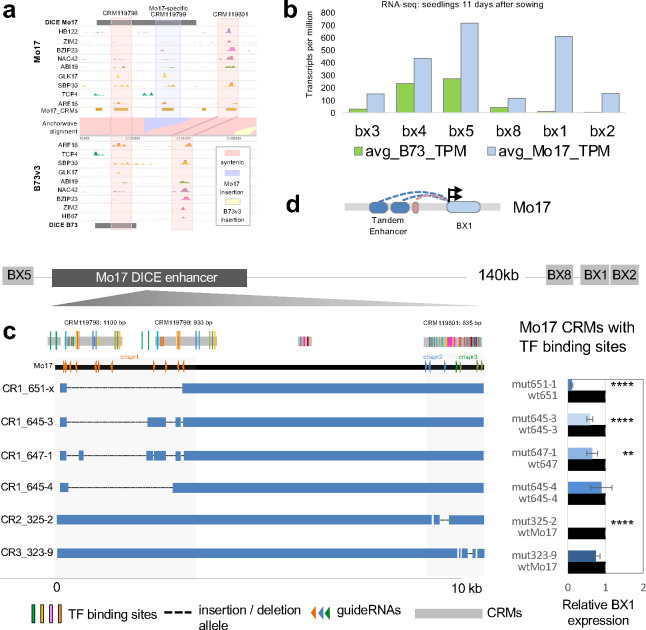
Regulatory elements are important constituents of plant genomes that have shaped ancient and modern crops. Their identification, function, and diversity in crop genomes however are poorly characterized, thus limiting our ability to harness their power for further agricultural advances using induced or natural variation. Here, we use DNA affinity purification-sequencing (DAP-seq) to map transcription factor (TF) binding events for 200 maize TFs belonging to 30 distinct families and heterodimer pairs in two distinct inbred lines historically used for maize hybrid plant production, providing empirical binding site annotation for 5.3% of the maize genome. TF binding site comparison in B73 and Mo17 inbreds reveals widespread differences, driven largely by structural variation, that correlate with gene expression changes. TF binding site presence-absence variation helps clarify complex QTL such as vgt1, an important determinant of maize flowering time, and DICE, a distal enhancer involved in herbivore resistance. Modification of TF binding regions via CRISPR-Cas9 mediated editing alters target gene expression and phenotype. Our functional catalog of maize TF binding events enables collective and comparative TF binding analysis, and highlights its value for agricultural improvement.
Figures


Similar articles
-
Transcription factor binding divergence drives transcriptional and phenotypic variation in maize.Nat Plants. 2025 Jun;11(6):1205-1219. doi: 10.1038/s41477-025-02007-8. Epub 2025 Jun 12. Nat Plants. 2025. PMID: 40506505
-
Advanced viral genome in vitro Cas9 editing (AdVICE): an overnight method for traceless and limitless manipulation of adenoviral and vector genomes with large transgenes.J Virol. 2025 Jun 17;99(6):e0226524. doi: 10.1128/jvi.02265-24. Epub 2025 May 21. J Virol. 2025. PMID: 40396759 Free PMC article.
-
Assessing the comparative effects of interventions in COPD: a tutorial on network meta-analysis for clinicians.Respir Res. 2024 Dec 21;25(1):438. doi: 10.1186/s12931-024-03056-x. Respir Res. 2024. PMID: 39709425 Free PMC article. Review.
-
Salmonella exploits host- and bacterial-derived β-alanine for replication inside host macrophages.Elife. 2025 Jun 19;13:RP103714. doi: 10.7554/eLife.103714. Elife. 2025. PMID: 40536105 Free PMC article.
-
Pharmacological and electronic cigarette interventions for smoking cessation in adults: component network meta-analyses.Cochrane Database Syst Rev. 2023 Sep 12;9(9):CD015226. doi: 10.1002/14651858.CD015226.pub2. Cochrane Database Syst Rev. 2023. PMID: 37696529 Free PMC article.
References
-
- Alonge M., Wang X., Benoit M., Soyk S., Pereira L., Zhang L., Suresh H., Ramakrishnan S., Maumus F., Ciren D., Levy Y., Harel T. H., Shalev-Schlosser G., Amsellem Z., Razifard H., Caicedo A. L., Tieman D. M., Klee H., Kirsche M., Aganezov S., Ranallo-Benavidez T. R., Lemmon Z. H., Kim J., Robitaille G., Kramer M., Goodwin S., McCombie W. R., Hutton S., Van Eck J., Gillis J., Eshed Y., Sedlazeck F. J., van der Knaap E., Schatz M. C., and Lippman Z. B.. 2020. ‘Major Impacts of Widespread Structural Variation on Gene Expression and Crop Improvement in Tomato’, Cell, 182: 145–61 e23. - PMC - PubMed
-
- Bang S., Zhang X., Gregory J., Chen Z., Galli M., Gallavotti A., and Schmitz R.J.. WUSCHEL-dependent chromatin regulation in maize inflorescence development at single-cell resolution bioRxiv 2024.05.13.593957
-
- Barrera L. A., Vedenko A., Kurland J. V., Rogers J. M., Gisselbrecht S. S., Rossin E. J., Woodard J., Mariani L., Kock K. H., Inukai S., Siggers T., Shokri L., Gordan R., Sahni N., Cotsapas C., Hao T., Yi S., Kellis M., Daly M. J., Vidal M., Hill D. E., and Bulyk M. L.. 2016. ‘Survey of variation in human transcription factors reveals prevalent DNA binding changes’, Science, 351: 1450–54. - PMC - PubMed
-
- Blanc-Mathieu R., Dumas R., Turchi L., Lucas J., and Parcy F.. 2024. ‘Plant-TFClass: a structural classification for plant transcription factors’, Trends Plant Sci, 29: 40–51. - PubMed
Publication types
Grants and funding
LinkOut - more resources
Full Text Sources
Miscellaneous