[Preprint]. 2024 Jun 3:2024.06.02.596989.
doi: 10.1101/2024.06.02.596989.

Persistent Neurological Deficits in Mouse PASC Reveal Antiviral Drug Limitations

Affiliations

Persistent Neurological Deficits in Mouse PASC Reveal Antiviral Drug Limitations

Abhishek Kumar Verma et al. bioRxiv. .

Abstract

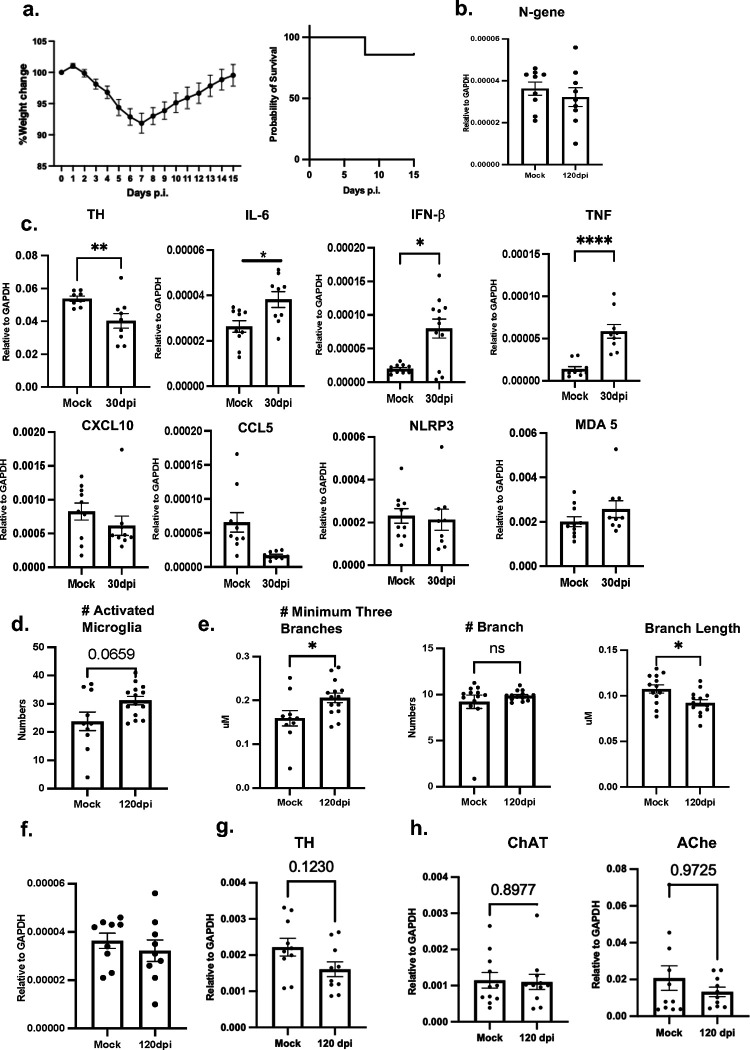
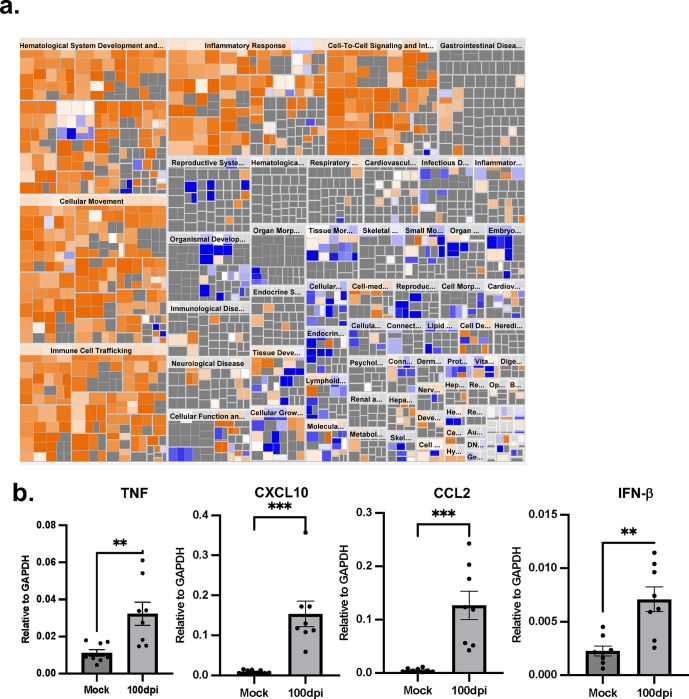
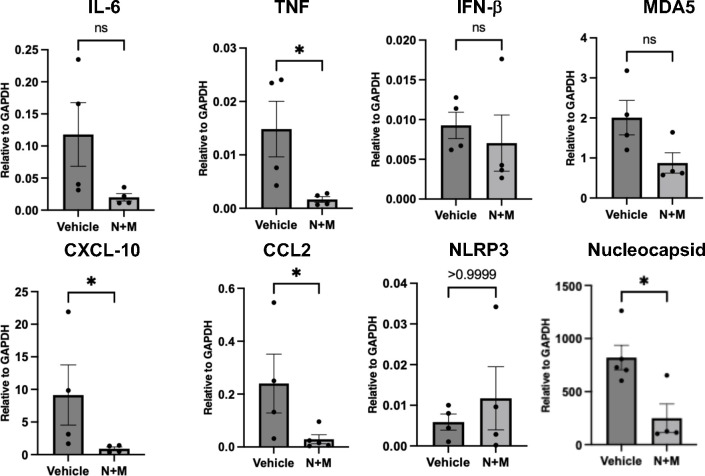
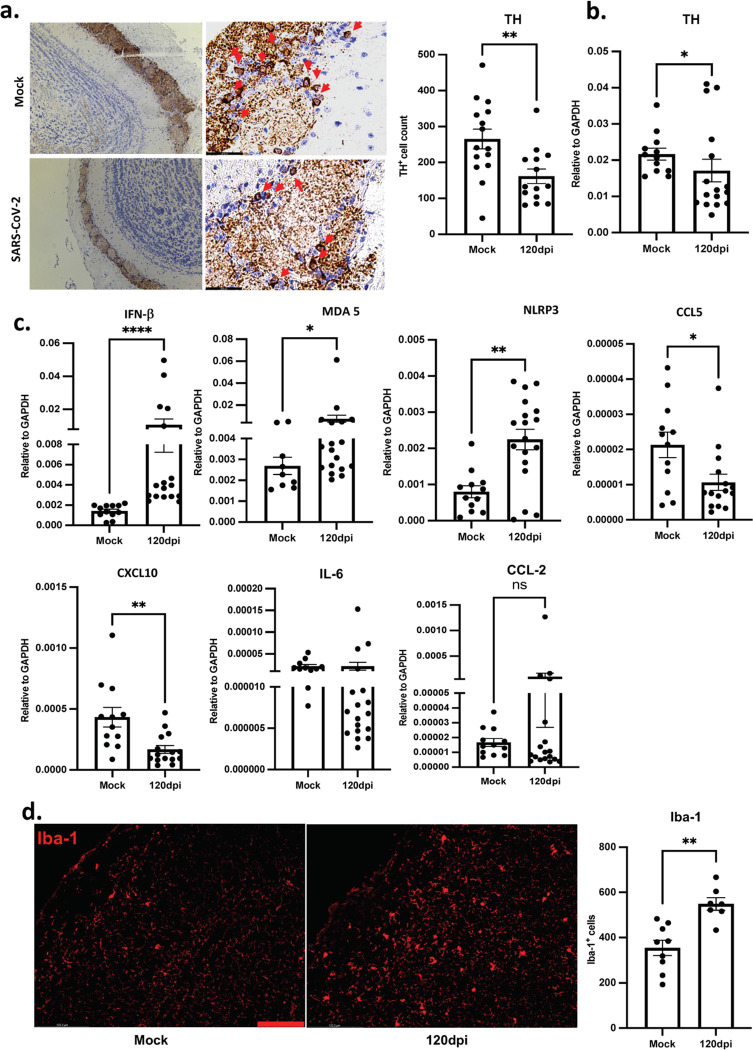
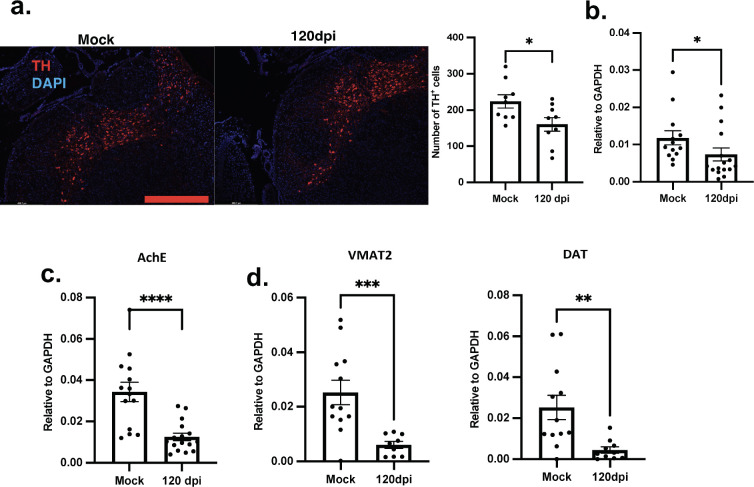
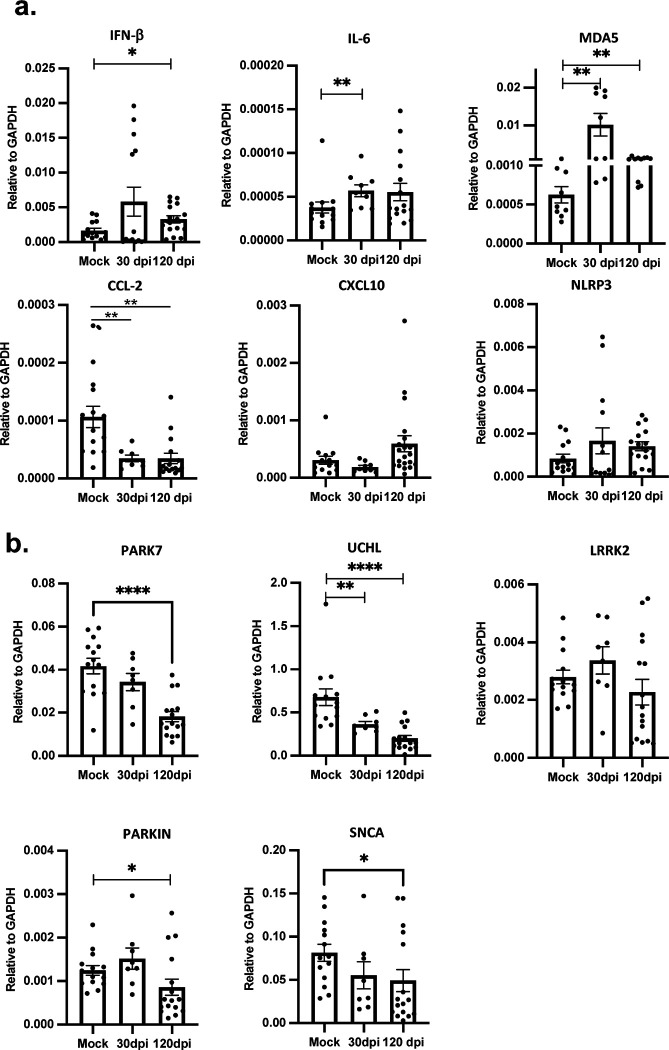
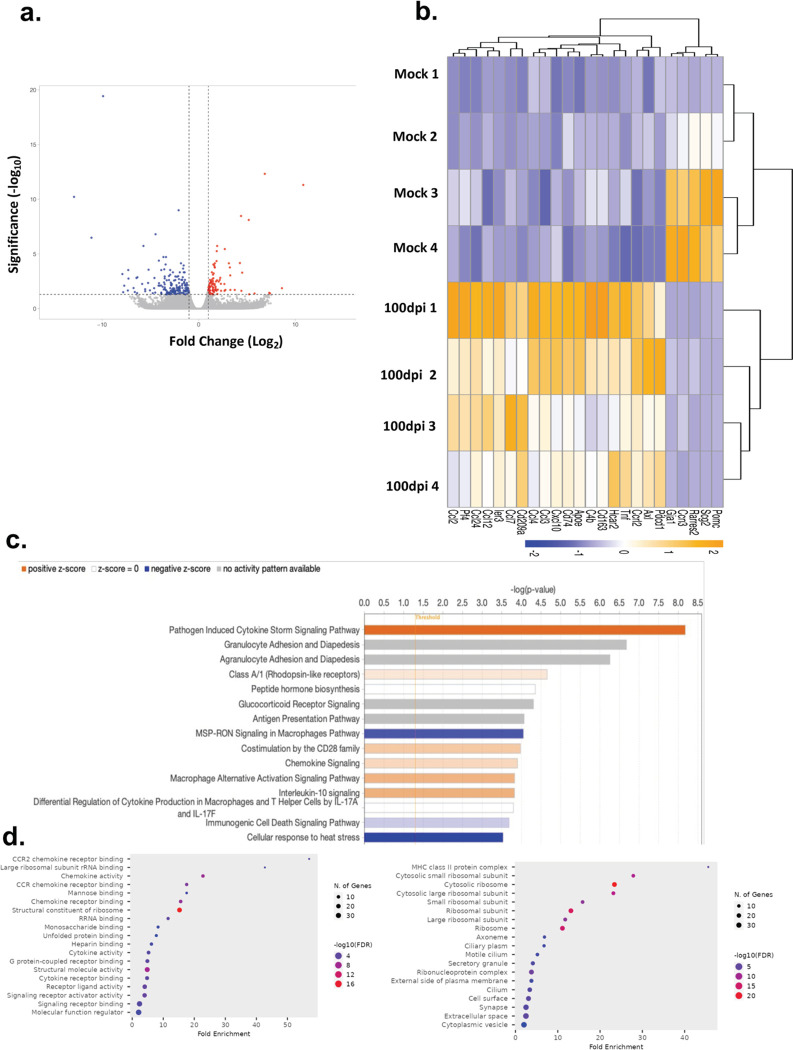
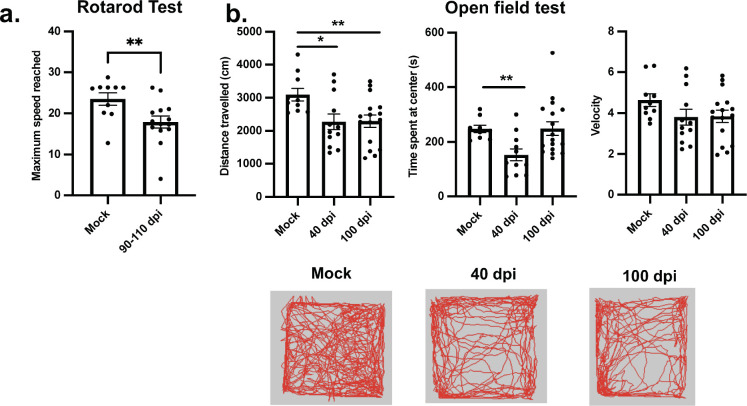
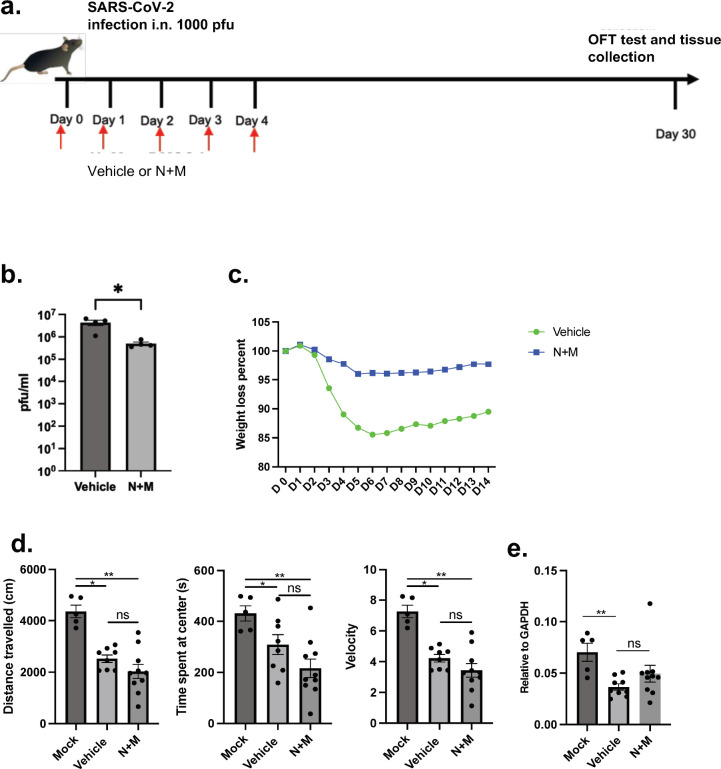
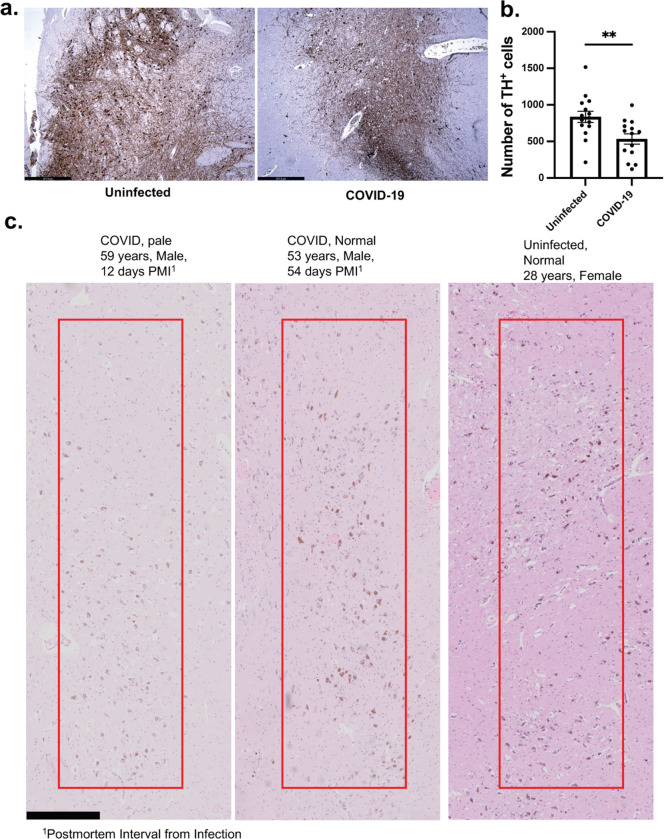
Post-Acute Sequelae of COVID-19 (PASC) encompasses persistent neurological symptoms, including olfactory and autonomic dysfunction. Here, we report chronic neurological dysfunction in mice infected with a virulent mouse-adapted SARS-CoV-2 that does not infect the brain. Long after recovery from nasal infection, we observed loss of tyrosine hydroxylase (TH) expression in olfactory bulb glomeruli and neurotransmitter levels in the substantia nigra (SN) persisted. Vulnerability of dopaminergic neurons in these brain areas was accompanied by increased levels of proinflammatory cytokines and neurobehavioral changes. RNAseq analysis unveiled persistent microglia activation, as found in human neurodegenerative diseases. Early treatment with antivirals (nirmatrelvir and molnupiravir) reduced virus titers and lung inflammation but failed to prevent neurological abnormalities, as observed in patients. Together these results show that chronic deficiencies in neuronal function in SARS-CoV-2-infected mice are not directly linked to ongoing olfactory epithelium dysfunction. Rather, they bear similarity with neurodegenerative disease, the vulnerability of which is exacerbated by chronic inflammation.

Keywords: Anosmia; Brain; Inflammation; Microglia; Neurodegeneration; Olfactory Bulb; SARS-CoV-2; Substantia Nigra; Tyrosine Hydroxylase.


Conflict of interest statement

Conflict of Interest The authors declare no conflict of interest directly related to this study. MWA is a cofounder and owns shares in Aromha, Inc. He has received in kind contributions from Eli Lilly and research support from TLL Pharma. He is an SAB member of Sudo Therapeutics, and consults for BMS and Transposon.

Figures

Extended data Figure 1.
Clinical manifestations, microglia activation and neurotransmitter expression in SARS-CoV-2 infected mice. (a) Weight loss and survival in mice infected with 1000pfu of SARS-COV-2. (b) N and GAPDH mRNA levels in the OB were determined by qPCR at 120 dpi. Data represent mean ± SEM of results pooled from 2 independent experiments; mock (9 mice) and 120 dpi (9 mice) and were analyzed using a Mann-Whitney U-test. (c) OB mRNA was analyzed for TH expression by qPCR. Data represent mean ± SEM of results pooled from 2 independent experiments: mock (8–9 mice) and 30 dpi (9–11 mice). Data were analyzed using a Mann-Whitney U-test, *P < 0.05. (d) Microglia were quantified and analyzed for phenotypic changes consistent with activation as described in Materials and Methods. Data were analyzed using a Mann-Whitney U-test. *P < 0.05. (e) Summary data of microglia skeleton changes. Data were analyzed using a Mann-Whitney U-test. *P < 0.05. (f) N and GAPDH mRNA levels in the SN were determined by qPCR at 120 dpi. Data represent mean ± SEM of results pooled from 2 independent experiments; mock (9 mice) and 120 dpi (9 mice) and were analyzed using a Mann-Whitney U-test. (g-h) TH, ChAT and AChE mRNA expression in brains from which the OB, substantia nigra and cerebellum were removed. Data represent mean ± SEM of results pooled from 2 independent experiments: mock, 120 dpi (5 mice). Data were analyzed using a Mann-Whitney U-test.
Extended Data Figure 2.
Differential gene expression in CD11b+ cells from SARS-COV-2 and mock-infected brains. CD11b+ cells were prepared from the brains of uninfected and infected mice at 100 dpi. RNA was prepared and analyzed by RNAseq as described in Materials and Methods. (a) Disease-specific canonical pathways upregulated in CD11b+ cells isolated from infected mouse brains were identified by IPA. Upregulation and downregulation of disease and functions are represented by blue and red color respectively. Inflammatory pathways and cellular trafficking pathways were upregulated. The ratio of differentially expressed genes for disease and functions is shown with Benjamini-Hochberg corrected p-values < 0.05, |fold-change| ≥ 2.5. (b) mRNA levels of specific pro-inflammatory genes are shown. Data represent mean ± SEM of results pooled from 2 independent experiments: mock (8 mice), 100 dpi (8 mice). Data were analyzed using a Mann-Whitney U-test. **P < 0.01, ***P < 0.001
Extended Data Figure 3.
Nimratrelvir and molnupiravir treatment reduces mRNA levels of pro-inflammatory genes and N gene. Levels of mRNA were analyzed using qPCR at day 2 dpi. Data represent mean ± SEM of results pooled from 5 mice and were analyzed using a Mann-Whitney U-test. **P < 0.01
Figure 1.
Figure 1.. Loss of TH-positive cells and increased neuroinflammation in the OB at 120 dpi.
(a) 4–5-month-old C57BL/6N mice were infected intranasally with 1000pfu SARS-COV-2. (left) Comparatively localized medial OB sections from infected and mock-infected animals were stained for TH. (right) Summary data of numbers of TH+ cells in periglomerular cells. Data represent mean ± SEM of results pooled from 3 independent experiments: mock (15 mice) and 120 dpi (14 mice). Data were analyzed using a Mann-Whitney U-test, **P < 0.01. Scale bar: 50 μm (b) OB mRNA was analyzed for TH expression by qPCR. Data represent mean ± SEM of results pooled from 3 independent experiments: mock (12 mice) and 120 dpi (16 mice). Data were analyzed using a Mann-Whitney U-test, *P < 0.05. (c) Proinflammatory cytokine mRNA expression was analyzed using qPCR. Data represent mean ± SEM of results pooled from 2 independent experiments. mock (10–12 mice) and 120 dpi (15 mice). Data were analyzed using a Mann-Whitney U-test. *P < 0.05, **P < 0.01, ****P < 0.0001. (d) Myeloid cells were stained for Iba1 (red). Three to six fields from mock (8 mice) and 120 dpi (7 mice) were analyzed. Left. Representative sections from control and infected mice at 120 dpi are shown. Right. Summary data show numbers of Iba1+ cell in the OB. Data are mean ± SEM of results pooled from 2 independent experiments with 3 mice per group. Data were analyzed using a Mann-Whitney U-test. **P < 0.01. Scale bar: 50 μm.
Figure 2.
Figure 2.. Loss of TH+ cells and changes of associated genes in substantia nigra.
(a) Sections from control and infected brains were prepared at 120 dpi and control mice and stained for TH expression. Numbers of TH+ cells in SN of mice were quantified as described in Materials and Methods. Summary data show numbers of TH+ cells in the SN. Data represent mean ± SEM of results pooled from 2 independent experiments: mock (9 mice) and 120 dpi (9 mice). Data were analyzed using a Mann-Whitney U-test, *P < 0.05. Scale bar represents 490μm (b) TH mRNA expression in the SN was analyzed using qPCR. Data show mean ± SEM of results pooled from 3 independent experiments: mock (12 mice) and 120 dpi (15 mice). Data were analyzed using a Mann-Whitney U-test, *P < 0.05. (c) RNA was prepared from the SN of infected and uninfected mice as described in Materials and Methods. AchE mRNA expression was analyzed using qPCR. Data represent mean ± SEM of results pooled from 3 independent experiments: mock (12 mice) and 120 dpi (13 mice). Data were analyzed using a Mann-Whitney U-test, *P < 0.05. (d) DAT2 and VMAT mRNA expression in the SN was analyzed by qPCR. Data represent mean ± SEM of results pooled from 2 independent experiments: mock (11 mice) and 120 dpi (9 mice). Data were analyzed using a Mann-Whitney U-test, *P < 0.05.
Figure 3.
Figure 3.. Neuroinflammation in the SN.
(a) RNA was prepared from SN isolated from infected (30dpi and 120 dpi) and uninfected mice as described in Materials and Methods and analyzed for proinflammatory cytokine mRNA expression by qPCR. Data represent mean ± SEM pooled from 2 independent experiments: mock (10–12 mice), 30 dpi (8 mice) and 120 dpi (14 mice). Data were analyzed using a Mann-Whitney U-tests. *P < 0.05, **P < 0.01. (b) mRNA expression for genes associated with Parkinson’s Disease was analyzed using qPCR. Data represent mean ± SEM of results pooled from 2 independent experiments. mock (10–12 mice), 30 dpi (8 mice) and 120 dpi (14 mice). Data were analyzed using a Mann-Whitney U-test. *P < 0.05, **P < 0.01 ****P < 0.0001.
Figure 4.
Figure 4.. Differential gene expression in CD11b+ cells from SARS-COV-2 and mock-infected brains.
CD11b+ cells were prepared from the brains of uninfected and infected mice at 100 dpi. RNA was prepared and analyzed by RNAseq as described in Materials and Methods. (a) Volcano plot depicting 246 differentially expressed genes in the CD11b+ cells of SARS-COV-2 infected mice in comparison with mock mice. Adjusted p-value ≤ .05, |fold-change| ≥ 2. (b) Heat map of differentially expressed inflammation-associated genes in SARS-COV-2–infected versus mock-infected CD11b+ samples. The scaled expression value (row Z score) is shown in a blue-red color scheme with red indicating higher expression, and blue lower expression. (c) Genes expressed at significantly higher levels in the CD11b+ cells were significantly enriched in Canonical Pathway Gene sets. X-axis denotes statistical significance as measured by negative logarithm of p-value. The ratio of differentially expressed genes was analyzed for statistical significance using Benjamini-Hochberg-corrected p-values < 0.05, |fold-change| ≥ 2.5. The red and blue bars represent categories for which specific functions are activated or repressed, respectively. (d-e) Gene ontology enrichment analysis for “Cellular Components” and “Molecular Functions pathway in CD11b+ cells are shown. Enrichment p values (corrected using the weighted Fisher’s method) <.05 are shown. The size and the color of each dot are proportional to the number of differentially expressed genes and the p-value respectively.
Figure 5.
Figure 5.. Behavioral manifestations.
(a) Rotarod testing was performed in mock-infected and infected mice at 100 dpi. Mice were infected with 1000pfu SARS-COV-2. The highest speed sustained by mice without falling was recorded. Data represent mean ± SEM of results pooled from 2 independent experiments: mock (10 mice) and 90–110 dpi (12 mice). Data were analyzed using a Mann-Whitney U-test. **P < 0.01. (b) Open field testing of SARS-COV-2-mice was performed using mock-infected, 40dpi and 100 dpi mice. Data represent mean ± SEM of results pooled from 2 independent experiments: mock (10 mice), 40dpi (12 mice) and 120 dpi (16 mice). Data were analyzed using a Mann-Whitney U-test. **P < 0.01.
Figure 6.
Figure 6.. Nimratrelvir and molnupiravir reduce clinical manifestations and virus loads but do not reverse behavioral abnormalities.
(a) Mice were infected with 1000pfu SARS-COV-2 and treated with nimratrelvir and molnupiravir (N+M) at the indicated times post infection. (b, c) Drug treatment reduced lung virus titers (b) and diminished weight loss (c). Data represent mean ± SEM of results pooled from 2 independent experiments. DMSO (n=9 mice), N+M (n=10 mice). (d) Open field testing was performed as described in Materials and Methods. Treatment with nimratrelvir and molnupiravir resulted in no improvement. Data represent mean ± SEM of results pooled from 2 independent experiments: mock (5 mice), DMSO (8 mice) and N+M (10 mice) (e) qPCR analysis shows TH mRNA levels in OB isolated from vehicle and drug-treated mice. Data represent mean ± SEM of results pooled from 2 independent experiments: mock (5 mice), DMSO (8 mice), and drug-treated (10 mice). Data were analyzed using a Mann-Whitney U-test. **P < 0.01.
Figure 7.
Figure 7.. TH quantification in patients with COVID-19.
(a) Immunostaining for TH was performed on the SN of autopsy samples from uninfected controls and patients with COVID-19 as described in Table 1 (b) Data show mean ± SEM. Uninfected control (n=15) and COVID-19 (n=14). Data were analyzed using a Mann-Whitney U-test. **P < 0.01. (c) H&E stained sections of the SN from COVID-19 patients were analyzed for changes in pigmentation. One COVID-19 patient had evident hypopigmentation (left), while pigmentation was normal in a second patient (middle) and an uninfected control (right). Boxed areas indicate sites of pigmentation.

Similar articles

References

    1. Wu Z. & McGoogan J. M. Characteristics of and Important Lessons From the Coronavirus Disease 2019 (COVID-19) Outbreak in China: Summary of a Report of 72 314 Cases From the Chinese Center for Disease Control and Prevention. JAMA 323, 1239–1242 (2020). 10.1001/jama.2020.2648 - DOI - PubMed
    1. Arentz M. et al. Characteristics and Outcomes of 21 Critically Ill Patients With COVID-19 in Washington State. JAMA 323, 1612–1614 (2020). 10.1001/jama.2020.4326 - DOI - PMC - PubMed
    1. Ellul M. A. et al. Neurological associations of COVID-19. Lancet Neurol 19, 767–783 (2020). 10.1016/S1474-4422(20)30221-0 - DOI - PMC - PubMed
    1. Khan S. H. et al. Delirium Incidence, Duration, and Severity in Critically Ill Patients With Coronavirus Disease 2019. Crit Care Explor 2, e0290 (2020). 10.1097/CCE.0000000000000290 - DOI - PMC - PubMed
    1. Chou S. H. et al. Global Incidence of Neurological Manifestations Among Patients Hospitalized With COVID-19-A Report for the GCS-NeuroCOVID Consortium and the ENERGY Consortium. JAMA Netw Open 4, e2112131 (2021). 10.1001/jamanetworkopen.2021.12131 - DOI - PMC - PubMed

Publication types