[Preprint]. 2024 Jun 17:2024.06.03.597252.
doi: 10.1101/2024.06.03.597252.

Comparative Analysis of Human-Chimpanzee Divergence in Brain Connectivity and its Genetic Correlates

Affiliations

Comparative Analysis of Human-Chimpanzee Divergence in Brain Connectivity and its Genetic Correlates

Yufan Wang et al. bioRxiv. .

Abstract

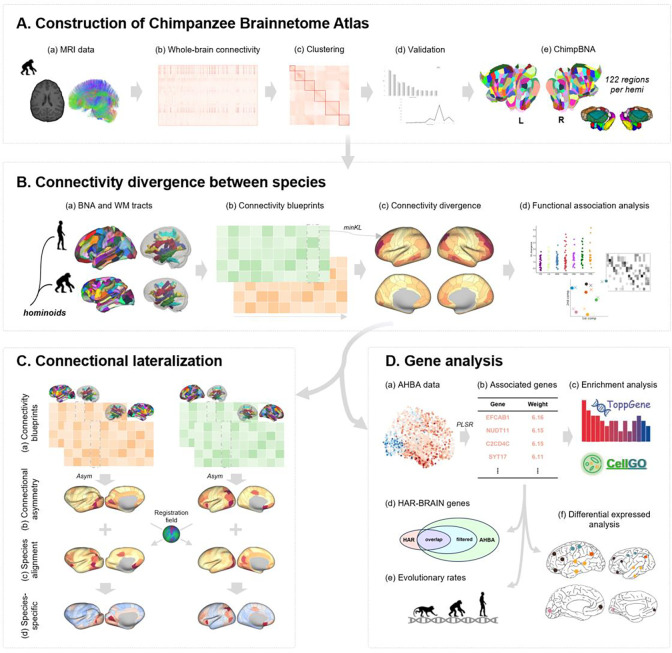
Chimpanzees (Pan troglodytes) are humans' closest living relatives, making them the most directly relevant comparison point for understanding human brain evolution. Zeroing in on the differences in brain connectivity between humans and chimpanzees can provide key insights into the specific evolutionary changes that might have occured along the human lineage. However, conducting comparisons of brain connectivity between humans and chimpanzees remains challenging, as cross-species brain atlases established within the same framework are currently lacking. Without the availability of cross-species brain atlases, the region-wise connectivity patterns between humans and chimpanzees cannot be directly compared. To address this gap, we built the first Chimpanzee Brainnetome Atlas (ChimpBNA) by following a well-established connectivity-based parcellation framework. Leveraging this new resource, we found substantial divergence in connectivity patterns across most association cortices, notably in the lateral temporal and dorsolateral prefrontal cortex between the two species. Intriguingly, these patterns significantly deviate from the patterns of cortical expansion observed in humans compared to chimpanzees. Additionally, we identified regions displaying connectional asymmetries that differed between species, likely resulting from evolutionary divergence. Genes associated with these divergent connectivities were found to be enriched in cell types crucial for cortical projection circuits and synapse formation. These genes exhibited more pronounced differences in expression patterns in regions with higher connectivity divergence, suggesting a potential foundation for brain connectivity evolution. Therefore, our study not only provides a fine-scale brain atlas of chimpanzees but also highlights the connectivity divergence between humans and chimpanzees in a more rigorous and comparative manner and suggests potential genetic correlates for the observed divergence in brain connectivity patterns between the two species. This can help us better understand the origins and development of uniquely human cognitive capabilities.


Figures

Figure 1.
Figure 1.. Analysis pipeline.
(A) Following a connectivity-based parcellation procedure, we used MRI data from chimpanzee brains (a) to construct the Chimpanzee Brainnetome Atlas. Tractography and similarity matrices were performed (b) for subsequent spectral clustering (c). The clustering results were validated using several indices (d), and the final parcellation of the whole brain was obtained (e). (B) We utilized the Brainnetome Atlas of humans and chimpanzees and homologous white matter tracts (a), to build regional connectivity blueprints for each species (b). The blueprints were used to explore the connectivity divergence between humans and chimpanzees (c), followed by functional association analysis of this divergence (d). (C) We used the connectivity blueprints from two hemispheres for each species (a) to investigate the asymmetric connectivity pattern (b). Myelin-based registration was used to align the two species into a common space (c). Thus the species-specific asymmetric connectivity pattern could be calculated (d). (D) AHBA data (a) was used to identify the genes associated with the connectivity divergence by PLSR (b), the filtered genes were input to gene enrichment analysis and cell-type enrichment analysis (c), as well as evolutionary investigation, including overlap with HAR-BRAIN genes (d), evolutionary rates (e), and differentially expressed analysis between the two species (f).
Figure 2.
Figure 2.. The Chimpanzee Brainnetome Atlas and connections of the chimpanzee brain.
(A) Cortical regions of the Chimpanzee Brainnetome Atlas. 100 cortical subregions were identified per hemisphere using anatomical connectivity profiles. (B) Region-to-tract connections of the chimpanzee brain. White matter tracts were reconstructed following protocols in the previous study , and the connectivity blueprint of an exemplar region, SFG.r, is shown. SFG.r, superior frontal gyrus, rostral part.
Figure 3.
Figure 3.. Connectivity divergence between species.
(A) Connectivity blueprints were used to calculate the KL divergence between species to determine the extent of dissimilarity between their connectivity profiles. Higher values in the divergence map indicated that the region in humans had a connectivity pattern that was more dissimilar to the regions in chimpanzees. (B) Connectivity divergence of several example ROIs, i.e., Pcun, IPL, and INS, were investigated at the subregion level. (C) The connectivity divergence map showed a very low correlation with the map of cortical expansion between chimpanzees and humans . The right panel showed the weighted local correlation between the area expansion map and the connectivity divergence map. Regions with high correlation coefficients indicate marked both cortical expansion and connectivity differences between chimpanzees and humans. (D) The divergence map was input for functional decoding. NeuroSynth terms with the highest three z-scores for each binarized mask of the divergence map were visualized. (E) Subregions of chimpanzees and human left brains were projected into a low-dimensional space using their connectivity profile, with each color representing a cortical system. The figure inset indicates the center of each system. Pcun, precuneus; IPL, inferior parietal lobule; INS, insular cortex.
Figure 4.
Figure 4.. Species-specific whole-brain level connectional lateralization.
(A) Connectivity blueprints were used to calculate the KL divergence between homotopic subregions between hemispheres. The divergence map of the connectional lateralization of the chimpanzees and humans was aligned and compared. (B) Species-specific asymmetric connectivity patterns were calculated, and the weighted local correlation with the connectivity divergence map is shown, where a higher value indicates both marked connectivity differences between species and asymmetry between hemispheres. (C) Connection probability of tracts of several example ROIs. In A39rd in humans, the inter-hemisphere differences were driven by IFOF, MdLF, and SLF2, while in IPL.v in chimpanzees, the asymmetry was mainly driven by SLF2. MTG.cv in the chimpanzee brain, in which the KL divergence was greater, showed differences in their tract connections, mostly driven separately by the ILF and VOF. A39rd, rostrodorsal area 39; IPL.v, inferior parietal lobule, ventral part; MTG.cv, middle temporal gyrus, caudoventral part; IFOF, inferior fronto-occipital fasciculus; MdLF, middle longitudinal fasciculus; SLF2, superior longitudinal fascicle II; ILF, inferior longitudinal fasciculus; VOF, vertical occipital fasciculus.
Figure 5.
Figure 5.. Gene association with connectivity divergence between species.
(A) The divergence map shows a significant correlation with the PLS1 score of genes with the AHBA dataset (left brain). (B) Cell-type enrichment analysis of genes identified using bootstrapping with the most positive or negative weights (|Z| > 3) in PLSR. (C) These genes were used in an enrichment analysis and found to be associated with neuronal projection and synapse formation processes. (D) 71 genes overlapped with the HAR-BRAIN genes (p < .005). (E) 56 genes had a dN/dS ratio > 1 (greater than 1 means less conserved in chimpanzees), but only 14 genes in the macaque against the human genome (Welch’s t-test p < .0001). (F) Differences in these filtered genes were compared using human and chimpanzee data from the PsychENCODE database. 1473 of 1939 genes that overlapped in the database were used for analysis. Three regions of interest exhibiting distinct connectivity divergence were considered, and a paired t-test was utilized to assess differences between the two species. Significant differences were found in first two regions, and the effect size was more significant in the STC and DFC than in V1C. STC, superior temporal cortex; DFC, dorsolateral frontal cortex; V1C, primary visual cortex. *** indicates p < .001.

Similar articles

References

    1. Staes N. et al. Evolutionary divergence of neuroanatomical organization and related genes in chimpanzees and bonobos. Cortex 118, 154–164, doi: 10.1016/j.cortex.2018.09.016 (2019). - DOI - PubMed
    1. Van Essen D. C. et al. Cerebral cortical folding, parcellation, and connectivity in humans, nonhuman primates, and mice. Proc Natl Acad Sci U S A 116, 26173–26180, doi: 10.1073/pnas.1902299116 (2019). - DOI - PMC - PubMed
    1. Herculano-Houzel S. The remarkable, yet not extraordinary, human brain as a scaled-up primate brain and its associated cost. Proc Natl Acad Sci U S A 109 Suppl 1, 10661–10668, doi: 10.1073/pnas.1201895109 (2012). - DOI - PMC - PubMed
    1. Hopkins W. D. et al. Evolution of the central sulcus morphology in primates. Brain Behav Evol 84, 19–30, doi: 10.1159/000362431 (2014). - DOI - PMC - PubMed
    1. Hopkins W. D., Li X., Crow T. & Roberts N. Vertex- and atlas-based comparisons in measures of cortical thickness, gyrification and white matter volume between humans and chimpanzees. Brain Struct Funct 222, 229–245, doi: 10.1007/s00429-016-1213-1 (2017). - DOI - PMC - PubMed

Publication types