

This is a preprint.
Differences in phenotype between long-lived memory B cells against Plasmodium falciparum merozoite antigens and variant surface antigens
- PMID: 38895251
- PMCID: PMC11185507
- DOI: 10.1101/2024.06.01.596978
Differences in phenotype between long-lived memory B cells against Plasmodium falciparum merozoite antigens and variant surface antigens
Update in
-
Differences in phenotype between long-lived memory B cells against Plasmodium falciparum merozoite antigens and variant surface antigens.PLoS Pathog. 2024 Oct 28;20(10):e1012661. doi: 10.1371/journal.ppat.1012661. eCollection 2024 Oct. PLoS Pathog. 2024. PMID: 39466842 Free PMC article.
Abstract
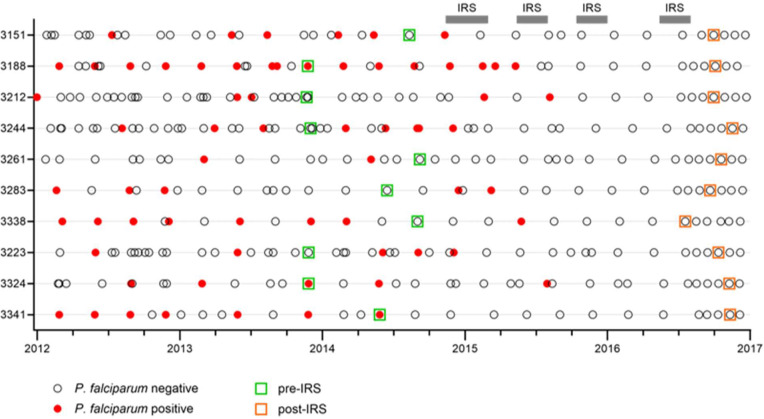
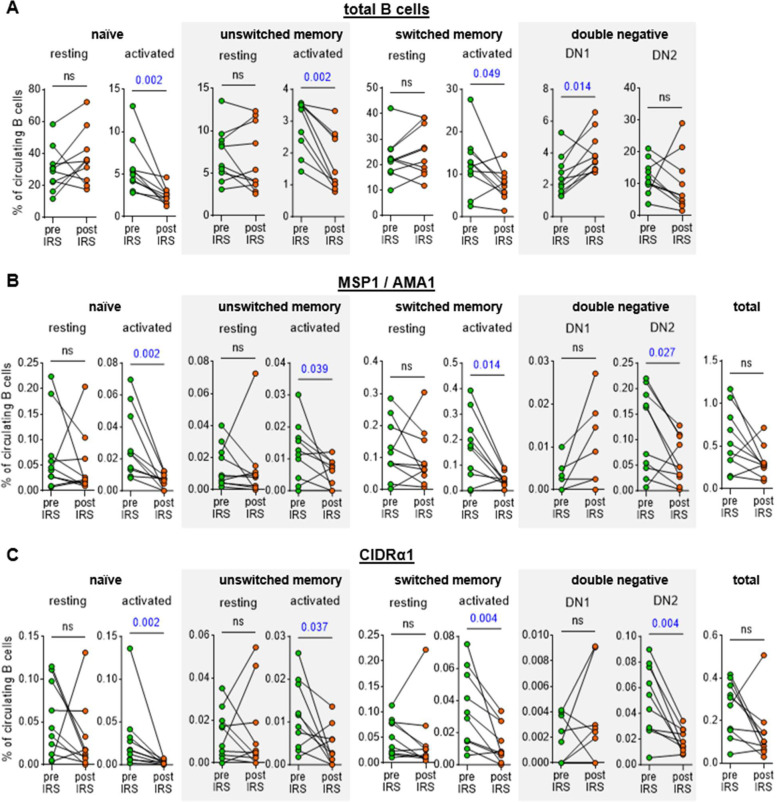
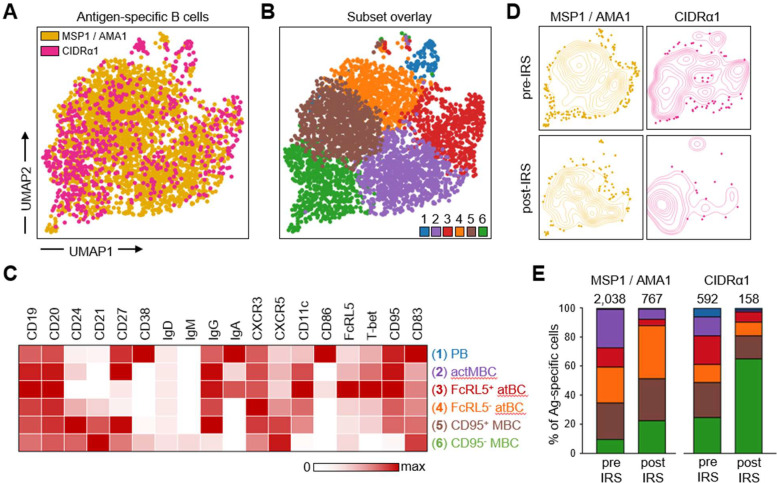
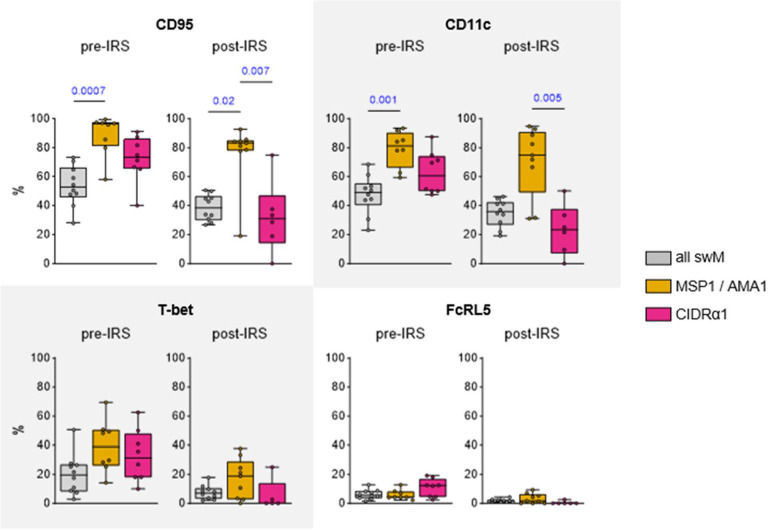
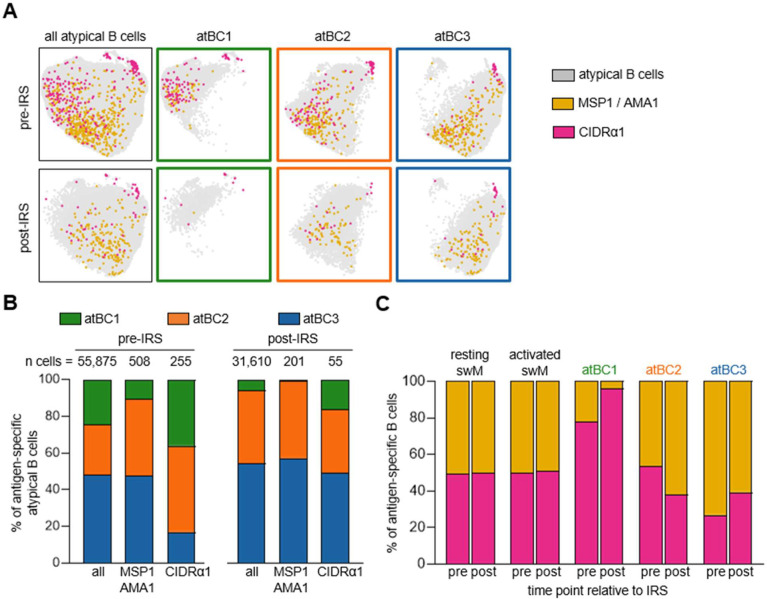
Plasmodium falciparum infections elicit strong humoral immune responses to two main groups of antigens expressed by blood-stage parasites: merozoite antigens that are involved in the erythrocyte invasion process and variant surface antigens that mediate endothelial sequestration of infected erythrocytes. Long-lived B cells against both antigen classes can be detected in the circulation for years after exposure, but have not been directly compared. Here, we studied the phenotype of long-lived memory and atypical B cells to merozoite antigens (MSP1 and AMA1) and variant surface antigens (the CIDRα1 domain of PfEMP1) in Ugandan adults before and after local reduction of P. falciparum transmission. After a median of 1.7 years without P. falciparum infections, the percentage of antigen-specific activated B cells declined, but long-lived antigen-specific B cells were still detectable in all individuals. The majority of MSP1/AMA1-specific B cells were CD95+CD11c+ memory B cells, which are primed for rapid differentiation into antibody-secreting cells, and FcRL5-T-bet- atypical B cells. On the other hand, most CIDRα1-specific B cells were CD95-CD11c- memory B cells. CIDRα1-specific B cells were also enriched among a subset of atypical B cells that seem poised for antigen presentation. These results point to differences in how these antigens are recognized or processed by the immune system and how P. falciparum-specific B cells will respond upon re-infection.
Figures
Similar articles
-
Differences in phenotype between long-lived memory B cells against Plasmodium falciparum merozoite antigens and variant surface antigens.PLoS Pathog. 2024 Oct 28;20(10):e1012661. doi: 10.1371/journal.ppat.1012661. eCollection 2024 Oct. PLoS Pathog. 2024. PMID: 39466842 Free PMC article.
-
Human leukocyte antigen class II alleles influence levels of antibodies to the Plasmodium falciparum asexual-stage apical membrane antigen 1 but not to merozoite surface antigen 2 and merozoite surface protein 1.Infect Immun. 2004 May;72(5):2762-71. doi: 10.1128/IAI.72.5.2762-2771.2004. Infect Immun. 2004. PMID: 15102786 Free PMC article.
-
Plasmodium berghei circumvents immune responses induced by merozoite surface protein 1- and apical membrane antigen 1-based vaccines.PLoS One. 2010 Oct 28;5(10):e13727. doi: 10.1371/journal.pone.0013727. PLoS One. 2010. PMID: 21060850 Free PMC article.
-
A Molecular Analysis of Memory B Cell and Antibody Responses Against Plasmodium falciparum Merozoite Surface Protein 1 in Children and Adults From Uganda.Front Immunol. 2022 Jun 2;13:809264. doi: 10.3389/fimmu.2022.809264. eCollection 2022. Front Immunol. 2022. PMID: 35720313 Free PMC article.
-
Plasmodium falciparum merozoite surface antigen-specific cytophilic IgG and control of malaria infection in a Beninese birth cohort.Malar J. 2019 Jun 11;18(1):194. doi: 10.1186/s12936-019-2831-x. Malar J. 2019. PMID: 31185998 Free PMC article.
References
-
- World malaria report 2023 [Internet]. [cited 2024 Mar 12]. Available from: https://www.who.int/teams/global-malaria-programme/reports/world-malaria...
Publication types
Grants and funding
LinkOut - more resources
Full Text Sources
Research Materials