[Preprint]. 2024 Jun 4:2024.06.03.597243.
doi: 10.1101/2024.06.03.597243.

The distribution of beneficial mutational effects between two sister yeast species poorly explains natural outcomes of vineyard adaptation

Affiliations

The distribution of beneficial mutational effects between two sister yeast species poorly explains natural outcomes of vineyard adaptation

Emery R Longan et al. bioRxiv. .

Update in

Abstract

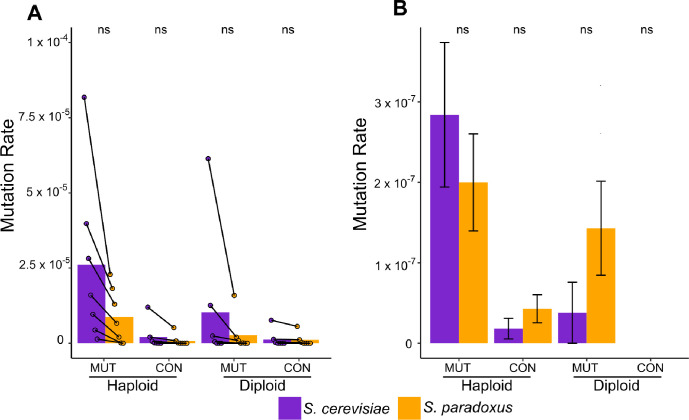
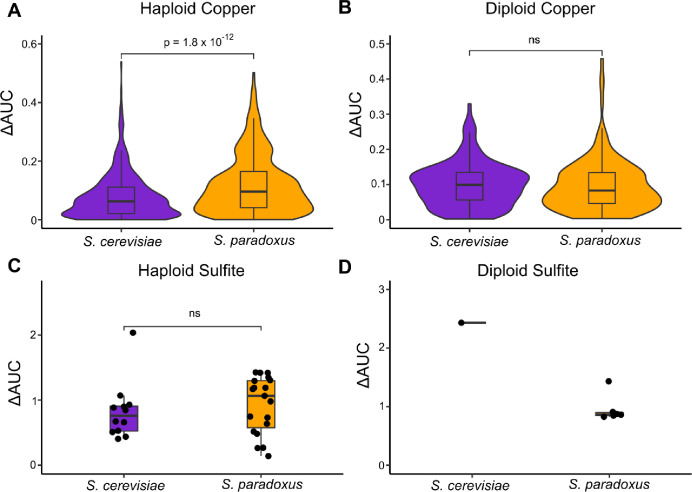
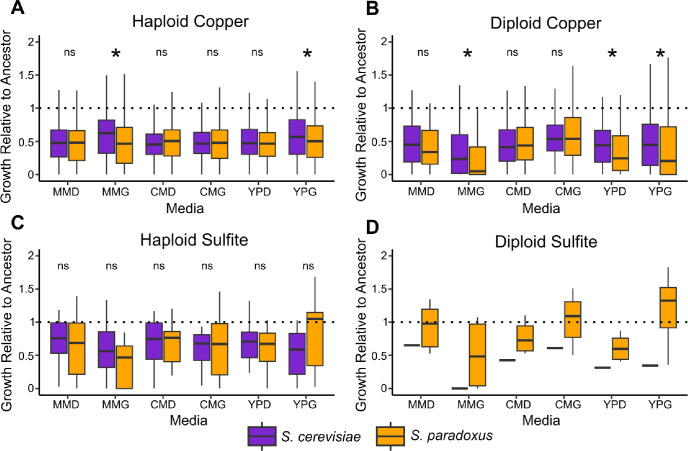
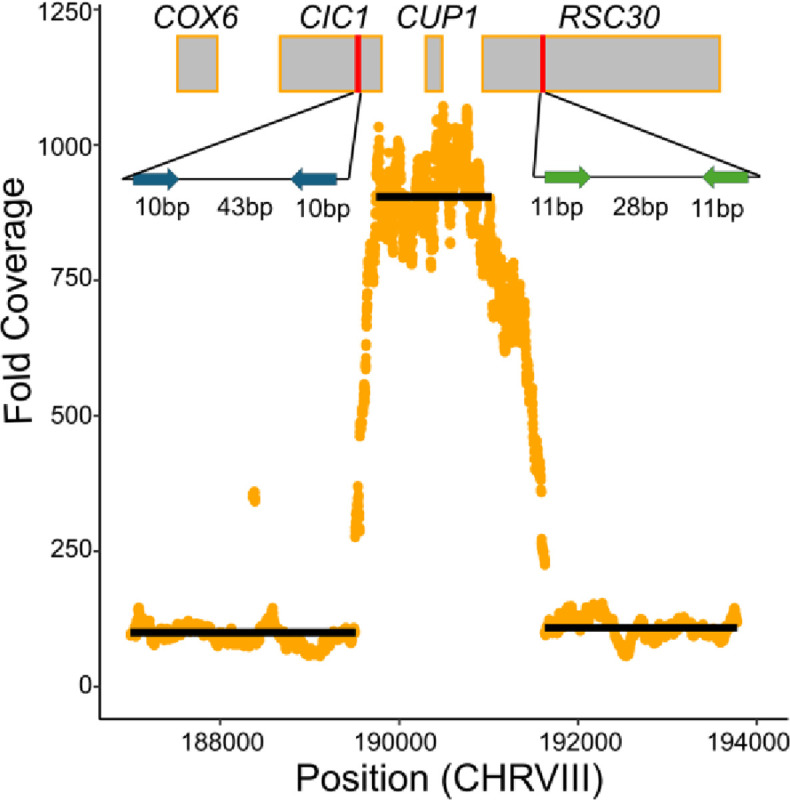
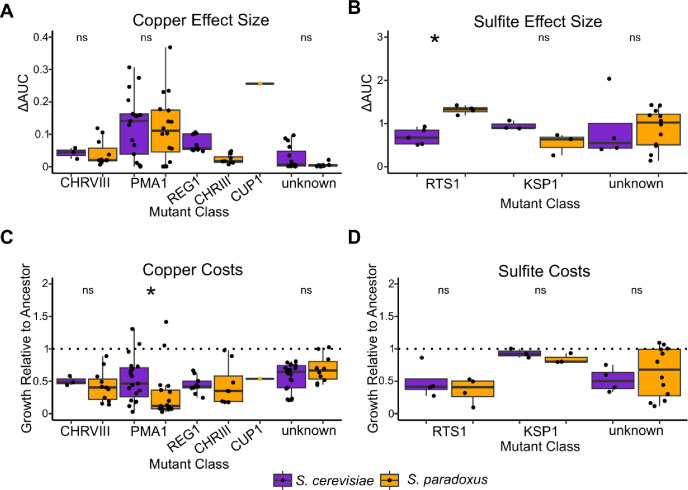
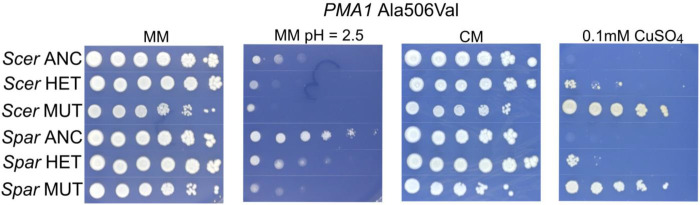
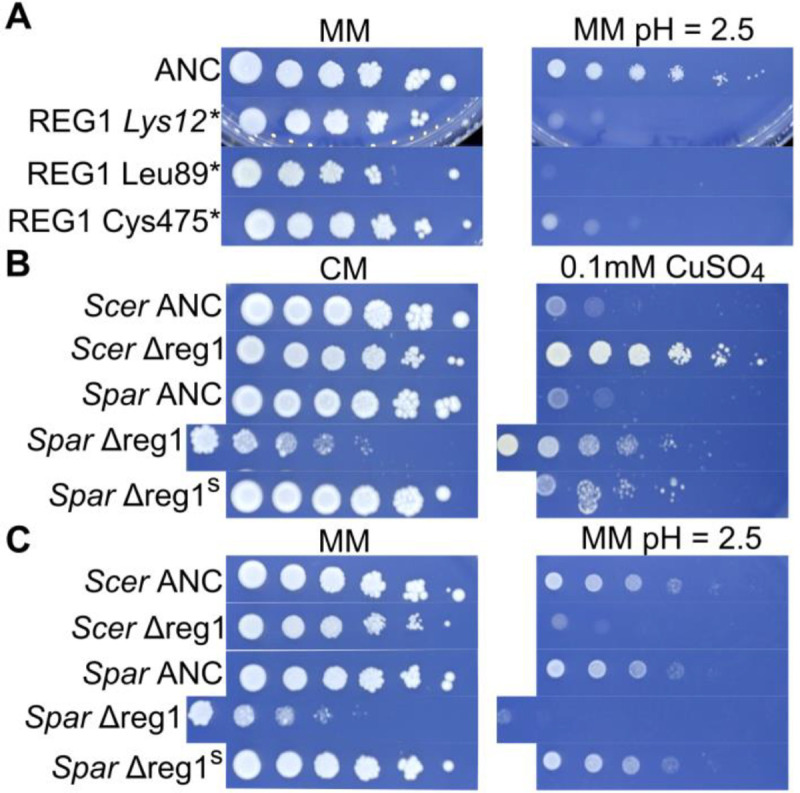
Domesticated strains of Saccharomyces cerevisiae have adapted to resist copper and sulfite, two chemical stressors commonly used in winemaking. S. paradoxus, has not adapted to these chemicals despite being consistently present in sympatry with S. cerevisiae in vineyards. This contrast represents a case of apparent evolutionary constraints favoring greater adaptive capacity in S. cerevisiae. In this study, we used a comparative mutagenesis approach to test whether S. paradoxus is mutationally constrained with respect to acquiring greater copper and sulfite resistance. For both species, we assayed the rate, effect size, and pleiotropic costs of resistance mutations and sequenced a subset of 150 mutants isolated from our screen. We found that the distributions of mutational effects displayed by the two species were very similar and poorly explained the natural pattern. We also found that chromosome VIII aneuploidy and loss of function mutations in PMA1 confer copper resistance in both species, whereas loss of function mutations in REG1 were only a viable route to copper resistance in S. cerevisiae. We also observed a single de novo duplication of the CUP1 gene in S. paradoxus but none in S. cerevisiae. For sulfite, loss of function mutations in RTS1 and KSP1 confer resistance in both species, but mutations in RTS1 have larger average effects in S. paradoxus. Our results show that even when the distributions of mutational effects are largely similar, species can differ in the adaptive paths available to them. They also demonstrate that assays of the distribution of mutational effects may lack predictive insight concerning adaptive outcomes.

Keywords: Saccharomyces cerevisiae; Saccharomyces paradoxus; copper; distribution of mutational effects; phenotype assays; sulfite; whole genome sequencing.


Figures

Figure 1.
Figure 1.. Mutation rate to copper or sulfite resistance does not differ between species.
Mutation rates in platings of mutagenized and mock mutagenized pools of S. cerevisiae and S. paradoxus. (A) Copper mutation rates for haploids and diploids as measured by the number of colonies divided by the number of cells plated. Points represent individual measurements for different copper concentrations and are paired by concentration. Left to right, points signify mean mutation rate for the two ancestor strains on 0.1, 0.15, 0.2, 0.3, 0.4, 0.5, and 0.6 mM CuSO4. Bars signify overall mutation rate with all concentrations pooled together. (B) Sulfite mutation rates for haploids and diploids measured as the total number of non-escapee strains recovered over the total number of cells plated across all concentrations. Error bars represent the standard deviation of the mutation rate measurement assuming a Poisson distribution for colony counts. In both panels, mutagenized pool measurements are denoted as “MUT” and mock mutagenized pool measurements are denoted as “CON”. Significance between species was assessed via paired t-tests and chi-square tests where applicable, and “ns” denotes a nonsignificant difference.
Figure 2.
Figure 2.. Limited species differences in effect size for copper and sulfite resistance mutants.
Resistance is measured by ΔAUC of colony size as a function of stressor concentration in mM. Significance values are derived from Kruskal-Wallis tests (ns indicates not significant). (A) Haploid non-escapee copper mutants (N = 1,107) show a larger effect size in S. paradoxus. (B) Diploid non-escapee copper mutants (N = 309) show no species difference in effect size. (C) Haploid sulfite mutants (N = 31) show no difference in effect size. (D) Diploid sulfite mutants (N = 7) have a low sample size that precluded a high confidence comparison of effect size.
Figure 3.
Figure 3.. Species differences in pleiotropic costs of recovered mutations.
Costs are measured by growth (colony size) in six media relative to the ancestor. Nonsignificant differences are denoted by “ns”, and significant differences are noted by an asterisk and represent p < 0.05 for a Kruskal-Wallis test after Bonferroni correcting for six comparisons. Media abbreviations are minimal media + dextrose (MMD), minimal media + glycerol (MMG), complete media + dextrose (CMD), complete media + glycerol (CMG), YP + dextrose (YPD), and YP + glycerol (YPG). (A) Costs for non-escapee haploid copper mutants with data in all permissive conditions (N = 999). S. paradoxus mutants display greater costs in MMG and YPG. (B) Costs for non-escapee diploid copper mutants with data in all permissive conditions (N = 286). S. paradoxus mutants display greater costs in MMG, YPD, and YPG. (C) Costs for non-escapee haploid sulfite mutants with data in all six conditions (N = 30). There are no significant differences in costs. (D) Costs for the diploid sulfite mutants recovered in this study (N = 7).
Figure 4.
Figure 4.. A de novo CUP1 duplication occurred in an S. paradoxus mutant.
The plot shows fold coverage as a function of chromosome VIII position for the S. paradoxus copper mutant YJF4464. Each point is a single nucleotide in the reference genome. Black lines represent average coverage across the positions they span. Rectangles are positions of genes plotted to scale. Coverage in this strain supports approximately 9 copies of CUP1. Red vertical segments represent two regions containing short, inverted repeats in the S. paradoxus genome. The insets are schematic depictions of these regions with the lengths of the repeats and intervening sequences. Inset colors indicate that the two regions contain repeats that are not identical in sequence to one another. Insets are not drawn to scale.
Figure 5.
Figure 5.. Effect sizes and costs for the mutant classes assigned as causal.
Effect sizes are measured as ΔAUC for the colony size measurements as a function of stressor concentration in mM. Costs are measured as average growth relative to the ancestor across six permissive conditions. Significant species differences are noted with an asterisk and represent p < 0.05 for a Kruskal-Wallis test after a Bonferroni correction, and “ns” denotes a nonsignificant difference. (A) Copper effect sizes for the major copper mutant classes recovered for both species. There are no significant species differences. (B) Sulfite effect sizes for the major sulfite mutant classes recovered for both species. RTS1 mutants have a significantly higher effect size in S. paradoxus. (C) Costs for the major copper mutant classes. PMA1 mutants incur greater costs in S. paradoxus. (D) Costs for the major sulfite mutant classes. There are no significant species differences.
Figure 6.
Figure 6.. Spot dilution phenotypes associated with the Ala506Val mutation in PMA1 in S. cerevisiae and S. paradoxus.
S. cerevisiae is denoted as “Scer”, and S. paradoxus is denoted as “Spar”. Haploid ancestors (ANC) are tolerant of low pH media and sensitive to 0.1 mM CuSO4. Backcrossed heterozygotes (HET) show intermediate low pH tolerance and copper resistance compared to their ancestors and the haploid mutants. Haploid mutants (MUT) display low pH sensitivity and copper resistance.
Figure 7.
Figure 7.. Spot dilution phenotypes associated with REG1 loss of function in both species.
(A) S. cerevisiae strain YJF3732 (ANC) and three REG1 nonsense mutants identified among sequenced strains. All three mutants show low pH sensitivity. (B) S. cerevisiae strain ancestor (YJF3732) and S. paradoxus strain ancestor (YJF3734) along with REG1 deletion strains derived from these strains. Spar Δreg1s refers to a suppressor mutant derived from “Spar Δreg1”. Deletion of REG1 leads to a severe growth defect in S. paradoxus and confers elevated copper resistance in both species. (C) Deletion of REG1 leads to low pH sensitivity in S. cerevisiae and S. paradoxus. However, the suppressor mutation rescues wild type growth.

Similar articles

References

    1. Adamo GM, Lotti M, Tamas MJ, Brocca S. 2012. Amplification of the CUP1 gene is associated with evolution of copper tolerance in Saccharomyces cerevisiae. Microbiology. 158(9):2325–35. - PubMed
    1. Alexander RM. 1985. The ideal and the feasible: physical constraints on evolution. Biol J Linn Soc. 26(4):345–58.
    1. Almeida P, Barbosa R, Bensasson D, Gonçalves P, Sampaio JP. 2017. Adaptive divergence in wine yeasts and their wild relatives suggests a prominent role for introgressions and rapid evolution at noncoding sites. Mol Ecol. 26(7):2167–82. - PubMed
    1. Almeida P, Barbosa R, Zalar P, Imanishi Y, Shimizu K, Turchetti B, Legras J, Serra M, Dequin S, Couloux A, et al. 2015. A population genomics insight into the Mediterranean origins of wine yeast domestication. Mol Ecol. 24(21):5412–27. - PubMed
    1. Amerine MA, Berg HW, Cruness WV. 1972. The technology of wine making 3rd edition. AVI Publishing Company, West Port. Connecticut.

Publication types