[Preprint]. 2024 Jun 11:2024.06.04.597431.
doi: 10.1101/2024.06.04.597431.

Development of highly multiplex targeted proteomics assays in biofluids using the Stellar mass spectrometer

Affiliations

Development of highly multiplex targeted proteomics assays in biofluids using the Stellar mass spectrometer

Deanna L Plubell et al. bioRxiv. .

Abstract

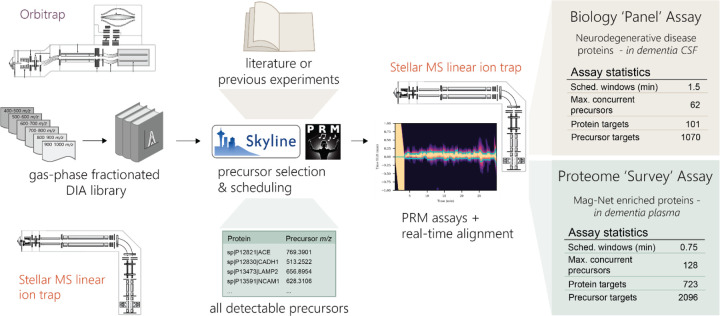
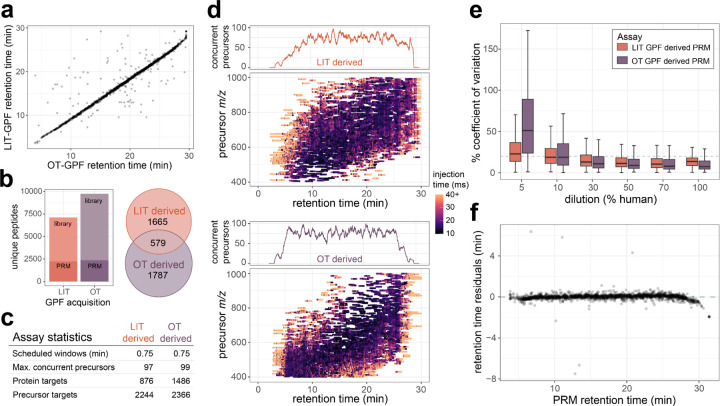
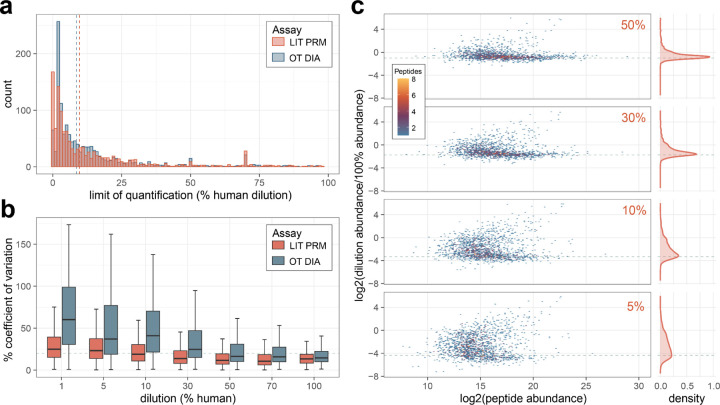
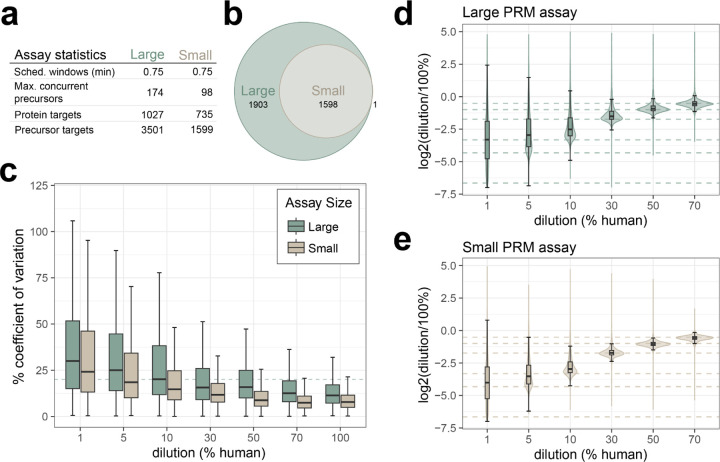
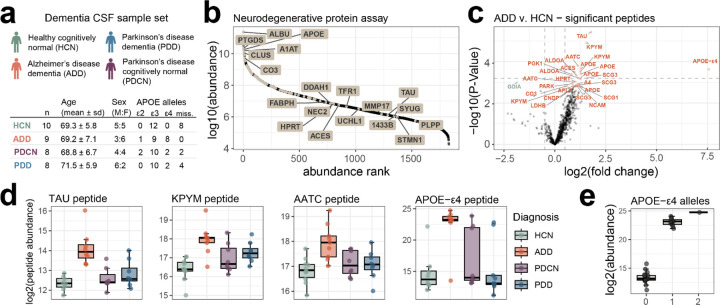
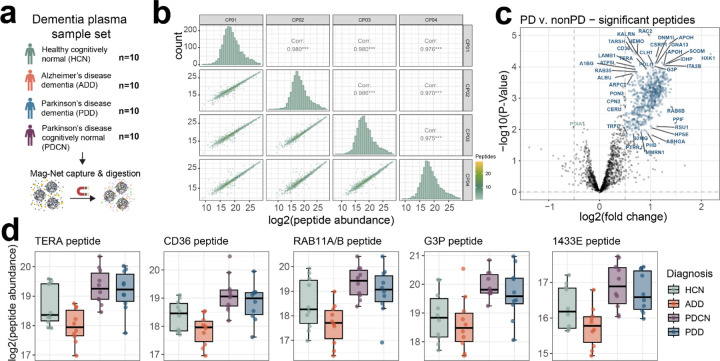
The development of targeted assays that monitor biomedically relevant proteins is an important step in bridging discovery experiments to large scale clinical studies. Targeted assays are currently unable to scale to hundreds or thousands of targets. We demonstrate the generation of large-scale assays using a novel hybrid nominal mass instrument. The scale of these assays is achievable with the Stellar mass spectrometer through the accommodation of shifting retention times by real-time alignment, while being sensitive and fast enough to handle many concurrent targets. Assays were constructed using precursor information from gas-phase fractionated (GPF) data-independent acquisition (DIA). We demonstrate the ability to schedule methods from an orbitrap and linear ion trap acquired GPF DIA library and compare the quantification of a matrix-matched calibration curve from orbitrap DIA and linear ion trap parallel reaction monitoring (PRM). Two applications of these proposed workflows are shown with a cerebrospinal fluid (CSF) neurodegenerative disease protein PRM assay and with a Mag-Net enriched plasma extracellular vesicle (EV) protein survey PRM assay.


Conflict of interest statement

CONFLICTS OF INTEREST The MacCoss Lab at the University of Washington has a sponsored research agreement with Thermo Fisher Scientific, the manufacturer of the mass spectrometry instrumentation used in this research. Additionally, MJM is a paid consultant for Thermo Fisher Scientific. PMR, CCJ, and LRH are employees of Thermo Fisher Scientific.

Figures

Figure 1.
Figure 1.. Workflow for the generation of scheduled PRM assays with gas-phase fractionated (GPF) DIA libraries.
GPF-DIA libraries can be acquired either directly on a Stellar MS linear ion trap or by an Orbitrap instrument, and their results extracted in Skyline. With the use of the PRM conductor tool in Skyline precursors can be refined for chromatographic performance and signal, and precursors can be selected to optimize both the selection of precursor m/z and relative retention time. Selected precursors are then acquired by PRM on the Stellar MS with dynamic real-time alignment. We demonstrate the selection of precursors for an assay targeting a panel of neurodegenerative associated proteins in CSF, and the selection of precursors for a ‘survey’ assay of the measurable proteome of Mag-Net enriched plasma.
Figure 2.
Figure 2.. CSF survey PRM assays developed from either Stellar MS linear ion trap (LIT) GPF library or Orbitrap (OT) GPF library data.
a) Gas-phase fractionated DIA was acquired by Exploris Orbitrap (OT) with 4 m/z staggered windows, or by Stellar MS linear ion trap (LIT) with 2 m/z discrete windows. From both libraries precursor targets were selected for LIT PRM assays using the PRM Conductor tool to filter and maximize selection of the number of precursors. b) General characteristic of the two assays generated from either GPF DIA library, with the number of concurrent precursors across the retention time for each assay. c) Targeted precursor acquisition windows from PRM conductor to optimize the windows across the precursor mass range and retention time space for both assays. e) The % coefficient of variation from peptides targeted in both assays at 5%, 10%, 50%, and 100% human CSF dilutions in chicken serum. f) Residuals from predicted retention times based on the OT GPF library and the measured retention times on the Stellar PRM assay derived from the OT GPF library.
Figure 3.
Figure 3.. Comparison of quantification by Stellar MS PRM and Orbitrap (OT) DIA.
Calibration curves of cerebrospinal fluid diluted into chicken serum were used to construct figures of merit. All data shown are for peptides measured on both Stellar MS LIT PRM assay and Exploris OT DIA experiment with 6 m/z precursor windows after demultiplexing. a) The distribution of the limit of quantification after transition optimization for both systems. b) Coefficient of variation from triplicate curve measurements. c) Distribution of peptide ratios at points on the calibration curve acquired by Stellar MS LIT PRM, ratios are calculated as the log2 ratio of mean summed precursor area of the dilution to the 100%. Dashed lines indicate the expected ratios for each dilution point.
Figure 4.
Figure 4.. Quantitative performance of Mag-Net enriched plasma EV PRM survey assay.
a) A GPF DIA library was acquired on the Stellar mass spectrometer, and two separate assays were constructed for either 3501 or 1599 precursors. Assays were acquired on a 30 min gradient, with 0.75 scheduled windows. b) The small assay was a subset of the large assay, with more stringent filtering parameters. Figures of merit were constructed from a matrix-matched calibration curve analyzed by both assays. c) The precision of the assays from 1% to 100% dilutions as measured by % coefficient of variation, with the dashed line indicating a 20% CV. The accuracy of the assay from 1% to 70% dilutions, calculated as the log2 ratio of mean summed precursor area of the dilution to the 100% for the d) large assay and e) small assay. Dashed lines indicate the expected ratios for each dilution point.
Figure 5.
Figure 5.. CSF neurodegenerative disease associated protein PRM assay.
a) Dementia CSF sample set statistics. b) The distribution of the targeted proteins (highlighted) across the whole CSF dynamic range as determined by orbitrap GPF DIA library. c) Differential abundance of target precursors between samples diagnosed with Alzheimer’s disease (AD) and healthy controls (HC). Precursors are labeled with their corresponding protein ID, and Benjamini-Hochberg adjusted p-value <0.05 colored, with orange representing precursors increased in AD relative to HC, and green decreased in AD relative to HC. d) Select peptides with significantly different abundance in AD compared to the other diagnosis groups. e) APOE-ε4 isoform specific peptide LGADMEDVR abundance separated by the number of APOE-ε4 alleles based on genotyping. The abundance of the peptide with zero alleles is based on the integration of the background signal in the absence of the peptide.
Figure 6.
Figure 6.. Mag-Net enriched plasma EV survey PRM assay captures distinct differences in Parkinson’s disease.
a) A plasma sample set consisting of age-matched healthy cognitively normal, Alzheimer’s disease dementia, Parkinson’s disease dementia, or Parkinson’s disease cognitively normal was enriched for EVs with the Mag-Net method and analyzed by PRM survey assay. b) Peptide abundance correlations and distribution between sample preparation QC replicates. c) TIC normalized peptide abundances between Parkinson’s with and without dementia compared to both healthy cognitively normal and Alzheimer’s disease dementia, with significantly changing peptides highlighted in blue if increased in Parkinson’s and green if increased in non-Parkinson’s samples. Peptides are labeled with their corresponding protein identifier. d) A selection of significantly changing peptides from proteins previously found to be differential in Parkinson’s disease studies.

References

    1. Katz D. H.; Robbins J. M.; Deng S.; Tahir U. A.; Bick A. G.; Pampana A.; Yu Z.; Ngo D.; Benson M. D.; Chen Z.-Z.; Cruz D. E.; Shen D.; Gao Y.; Bouchard C.; Sarzynski M. A.; Correa A.; Natarajan P.; Wilson J. G.; Gerszten R. E. Proteomic Profiling Platforms Head to Head: Leveraging Genetics and Clinical Traits to Compare Aptamer- and Antibody-Based Methods. Sci. Adv. 2022, 8 (33), eabm5164. 10.1126/sciadv.abm5164. - DOI - PMC - PubMed
    1. Ngo D.; Sinha S.; Shen D.; Kuhn E. W.; Keyes M. J.; Shi X.; Benson M. D.; O’Sullivan J. F.; Keshishian H.; Farrell L. A.; Fifer M. A.; Vasan R. S.; Sabatine M. S.; Larson M. G.; Carr S. A.; Wang T. J.; Gerszten R. E. Aptamer-Based Proteomic Profiling Reveals Novel Candidate Biomarkers and Pathways in Cardiovascular Disease. Circulation 2016, 134 (4), 270–285. 10.1161/CIRCULATIONAHA.116.021803. - DOI - PMC - PubMed
    1. Emilsson V.; Ilkov M.; Lamb J. R.; Finkel N.; Gudmundsson E. F.; Pitts R.; Hoover H.; Gudmundsdottir V.; Horman S. R.; Aspelund T.; Shu L.; Trifonov V.; Sigurdsson S.; Manolescu A.; Zhu J.; Olafsson Ö.; Jakobsdottir J.; Lesley S. A.; To J.; Zhang J.; Harris T. B.; Launer L. J.; Zhang B.; Eiriksdottir G.; Yang X.; Orth A. P.; Jennings L. L.; Gudnason V. Co-Regulatory Networks of Human Serum Proteins Link Genetics to Disease. Science 2018, 361 (6404), 769–773. 10.1126/science.aaq1327. - DOI - PMC - PubMed
    1. Hoofnagle A. N.; Wener M. H. The Fundamental Flaws of Immunoassays and Potential Solutions Using Tandem Mass Spectrometry. J. Immunol. Methods 2009, 347 (1), 3–11. 10.1016/j.jim.2009.06.003. - DOI - PMC - PubMed
    1. Hoofnagle Andrew N.; Eckfeldt John H.; Lutsey Pamela L. Vitamin D–Binding Protein Concentrations Quantified by Mass Spectrometry. N. Engl. J. Med. 2015, 373 (15), 1480–1482. 10.1056/NEJMc1502602. - DOI - PMC - PubMed

Publication types