[Preprint]. 2024 Jun 6:2024.06.04.596911.
doi: 10.1101/2024.06.04.596911.

TNBC response to paclitaxel phenocopies interferon response which reveals cell cycle-associated resistance mechanisms

Affiliations

TNBC response to paclitaxel phenocopies interferon response which reveals cell cycle-associated resistance mechanisms

Nicholas L Calistri et al. bioRxiv. .

Update in

Abstract

Paclitaxel is a standard of care neoadjuvant therapy for patients with triple negative breast cancer (TNBC); however, it shows limited benefit for locally advanced or metastatic disease. Here we used a coordinated experimental-computational approach to explore the influence of paclitaxel on the cellular and molecular responses of TNBC cells. We found that escalating doses of paclitaxel resulted in multinucleation, promotion of senescence, and initiation of DNA damage induced apoptosis. Single-cell RNA sequencing (scRNA-seq) of TNBC cells after paclitaxel treatment revealed upregulation of innate immune programs canonically associated with interferon response and downregulation of cell cycle progression programs. Systematic exploration of transcriptional responses to paclitaxel and cancer-associated microenvironmental factors revealed common gene programs induced by paclitaxel, IFNB, and IFNG. Transcription factor (TF) enrichment analysis identified 13 TFs that were both enriched based on activity of downstream targets and also significantly upregulated after paclitaxel treatment. Functional assessment with siRNA knockdown confirmed that the TFs FOSL1, NFE2L2 and ELF3 mediate cellular proliferation and also regulate nuclear structure. We further explored the influence of these TFs on paclitaxel-induced cell cycle behavior via live cell imaging, which revealed altered progression rates through G1, S/G2 and M phases. We found that ELF3 knockdown synergized with paclitaxel treatment to lock cells in a G1 state and prevent cell cycle progression. Analysis of publicly available breast cancer patient data showed that high ELF3 expression was associated with poor prognosis and enrichment programs associated with cell cycle progression. Together these analyses disentangle the diverse aspects of paclitaxel response and identify ELF3 upregulation as a putative biomarker of paclitaxel resistance in TNBC.

Keywords: cell cycle; interferon response; live-cell imaging; single-cell RNA sequencing (scRNA-seq); transcription factor; triple negative breast cancer (TNBC).


Figures
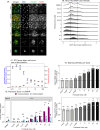
Figure 1:
Figure 1:. Paclitaxel modulates multiple cancer associated phenotypes.
1A) Representative fluorescent images showing HCC1143 cells treated with DMSO or Paclitaxel at the listed doses for 72 hours and stained with DAPI, p16-INK4A, and TUBB3. 1B) Ridgeplot showing impact of paclitaxel treatment on DAPI total nuclear intensity as a proxy for nuclear content. Dashed lines indicate local maxima in the DMSO control condition corresponding with 2N and 4N nuclear state. 1C) Normalized cell count and fraction of multinucleated cells for HCC1143 treated with serial titration of Paclitaxel for 72 hours. Error bar indicates SEM across 6 replicates. 1D) Barplots showing mean TUBB3 and p16/p15 cytoplasmic staining intensity for triplicate wells of HCC1143 treated with a range of Paclitaxel and normalized to paired DMSO control (horizontal line). Significance assessed with Dunnett’s test. 1E) Barplot comparing the fraction of cPARP positive cells for mononucleated (magenta) versus multinucleated (cyan) cells within the same treatment condition. cPARP positive threshold was set to the 99th quantile of DMSO treated cells total cPARP nuclear intensity (Supplemental Figure 1C). Significance assessed with proportions test. For all statistics: * = p<0.05, ** = p<0.01, *** = p<0.001.
Figure 2:
Figure 2:. Cells surviving paclitaxel treatment halt cycling and upregulate interferon response genes.
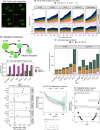
2A) UMAP color coded by treatment condition. DMSO_24 = 0.1% DMSO for 24 hours, DMSO_72 = 0.1% DMSO for 72 hours, PTX_24 = 1nM Paclitaxel for 24 hours, PTX_72 = 1nM Paclitaxel for 72 hours. 2B) Barplot showing proportion of each condition assigned to G1, S, or G2M cell cycle state based on transcriptional profile. 2C,2D) Volcano plot of differentially expressed genes for Paclitaxel treatment versus DMSO at 24 (2C) and 72 (2D) hours. Differentially expressed genes (black) determined with cutoffs of Benjamini Hochberg corrected p<0.05 and absolute Log2FoldChange > 0.5. 2D) Reactome pathway enrichment results for genes significantly upregulated after paclitaxel treatment at 24 hours. Size indicates the number of genes upregulated within the pathway, color indicates significance. 2E) Volcano plot of differentially expressed genes for Paclitaxel treatment versus DMSO at 72 hours. Differentially expressed genes (black) determined with cutoffs of Benjamini Hochberg corrected p<0.05 and absolute Log2FoldChange > 0.5. 2F) Reactome pathway enrichment results for genes significantly upregulated after paclitaxel treatment at 72 hours. Size indicates the number of genes upregulated within the pathway, color indicates significance.
Figure 3:
Figure 3:. Paclitaxel response activates canonical interferon response genes.
3A) UMAP showing the scRNA-seq landscape for ligand perturbations. IFNB = Interferon-Beta, OSM = Oncostatin-M, NOTCHi_IFNB = Notch inhibitor + Interferon-Beta, NOTCHi = Notch inhibitor, TGFB = Transforming Growth Factor Beta, IFNG = Interferon-Gamma, LTA = Lymphotoxin-Alpha, PBS = Phosphate Buffered Saline (control). 3B) Heatmap showing the Pearson correlation for all gene log2 fold-change between perturbation versus time-matched control. Inset number and color indicate correlation. 3C,D) Gene enrichment map for Paclitaxel uniquely upregulated (3C) and Paclitaxel+Interferon shared upregulated (3D) genes. Color indicates significance, size indicates number of upregulated genes, and lines connect ontologies with shared elements. 3E) ChEA3 transcription factor enrichment ranks computed from 140 Paclitaxel uniquely upregulated genes (x axis) versus 120 Paclitaxel-Interferon shared upregulated genes (y axis). Lower rank indicates higher imputed activity. TFs to the lower right of the diagonal have higher imputed activity within the PTX+IFN shared upregulated gene set, and TFs to the upper left of the diagonal have higher imputed activity within the PTX uniquely upregulated gene set. 3F) Bar plot showing Average Log2FC from paclitaxel treated scRNA-seq data for the 24 top ranked transcription factors (intersect of top 15 ranked for PTX unique or PTX shared individually). Transcription factor names in red had differential upregulation (average log2 fold-change > 0.25, FDR < 0.01) at either 24 or 72 hours of paclitaxel treatment compared to vehicle control.
Figure 4:
Figure 4:. Inhibition of paclitaxel-induced transcription factors alters proliferation and nuclear morphology.
4A-B) Barplots showing relative cell count (A) and proportion of multinucleated cells (B). Cell count is normalized to the same cell-line DMSO + siNonTarget control. Bars show the mean of three cell lines, and error bar indicates SEM. Relative cell count statistics computed with Fisher’s multi test applied to Two-tailed Student’s T-test per cell line, and fraction multinucleated statistics computed with Fisher’s multi test applied to proportions test per cell line. Heatmap of all values in Supplement 4A, 4B. Not shown: secondary positive growth (siGAPD) and negative growth (siKIF11) controls 4C) Principal Component results for each siRNA knockdown where each combination of cell line (HCC1143, HCC1806, MDA-MB-468), feature (relative cell count, fraction multinucleated) and condition (DMSO, PTX) is considered a feature (Supplemental Figure 4C). 4D) The Euclidean feature-distance from NonTarget control for each siRNA. Heatmap of scaled feature values in Supplemental Figure 4C. For all statistics: * = p<0.05, ** = p<0.01, *** = p<0.001.
Figure 5:
Figure 5:. ELF3 and FOSL1 mediate cell cycle progression under paclitaxel treatment.
5A) Representative images showing the HCC1143 cell cycle reporter line and a mitotic even occurring over 105 minutes. Orange text indicates automatically assigned cell cycle for the processed images. 5B) Relative (normalized to total cell number at earliest time point) cell count for each phase over time for each siRNA condition +/− paclitaxel (PTX). 5C) Schematic showing the underlying structure of permitted transitions used in the Markov Model. 5D) Mitotic failure rate computed from Markov model transition rates. Mitotic failure rate is calculated as the ratio of M->multinucleated transitions divided by the sum of M->G1 and M->multinucleated transition rates. 5F) PTX + siRNA synergy computed as the ratio of inferred phase duration for combination (siRNA + PTX) versus Highest Single Agent (HSA, highest duration for either siRNA or PTX treatment alone). Value of 1 indicates no change in combination, values greater than 1 indicate synergy and values less than 1 indicate antagonism. 5G) Overall survival for the Metabric breast cancer cohort striated by ELF3 mRNA expression. High = top quartile of ELF3 expression, IQR = inner quartile range of ELF3 expression, and low = lowest quartile of ELF3 expression. 5H) MSigDB Gene Set Enrichment (GSEA) results for ELF3 high versus ELF3 group. Horizontal line represents a FDR threshold of 0.05.

Similar articles

References

    1. Bauer K.R., et al., Descriptive analysis of estrogen receptor (ER)-negative, progesterone receptor (PR)-negative, and HER2-negative invasive breast cancer, the so-called triple-negative phenotype. Cancer, 2007. 109(9): p. 1721–1728. - PubMed
    1. Early Breast Cancer Trialists’ Collaborative, G., Comparisons between different polychemotherapy regimens for early breast cancer: meta-analyses of long-term outcome among 100 000 women in 123 randomised trials. The Lancet, 2012. 379(9814): p. 432–444. - PMC - PubMed
    1. Mustacchi G. and De Laurentiis M., The role of taxanes in triple-negative breast cancer: literature review. Drug Design, Development and Therapy, 2015: p. 4303. - PMC - PubMed
    1. Liedtke C., et al., Response to Neoadjuvant Therapy and Long-Term Survival in Patients With Triple-Negative Breast Cancer. Journal of Clinical Oncology, 2023. 41(10): p. 1809–1815. - PubMed
    1. Foulkes W.D., Smith I.E., and Reis-Filho J.S., Triple-Negative Breast Cancer. New England Journal of Medicine, 2010. 363(20): p. 1938–1948. - PubMed

Publication types