[Preprint]. 2025 Apr 28:2024.06.04.597343.
doi: 10.1101/2024.06.04.597343.

A mathematical model for ketosis-prone diabetes suggests the existence of multiple pancreatic β-cell inactivation mechanisms

A mathematical model for ketosis-prone diabetes suggests the existence of multiple pancreatic β-cell inactivation mechanisms

Sean A Ridout et al. bioRxiv. .

Update in

Abstract

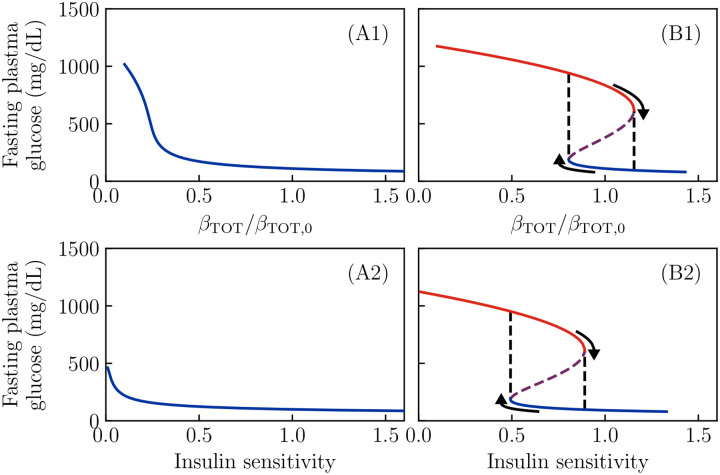
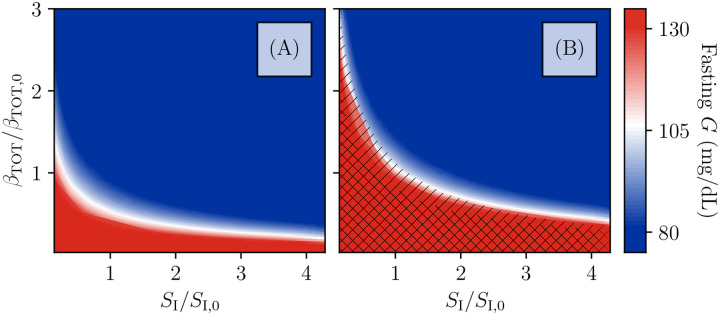
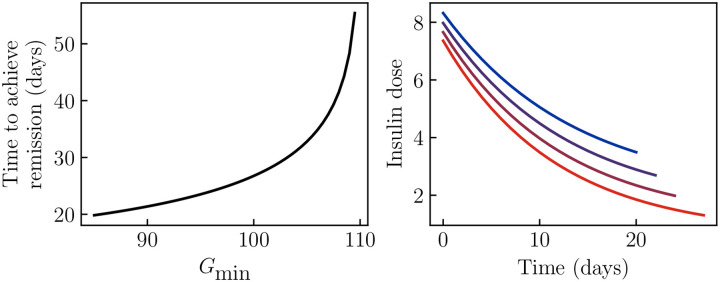
Ketosis-prone diabetes mellitus (KPD) is a subtype of type 2 diabetes, which presents much like type 1 diabetes, with dramatic hyperglycemia and ketoacidosis. Although KPD patients are initially insulin-dependent, after a few months of insulin treatment, roughly 70% undergo near-normoglycemia remission and can maintain blood glucose without insulin, as in early type 2 diabetes or prediabetes. Here, we propose that these phenomena can be explained by the existence of a fast, reversible glucotoxicity process, which may exist in all people but be more pronounced in those susceptible to KPD. We develop a simple mathematical model of the pathogenesis of KPD, which incorporates this assumption, and show that it reproduces the phenomenology of KPD, including variations in the ability for patients to achieve and sustain remission. These results suggest that a variation of our model may be able to quantitatively describe variations in the course of remission among individuals with KPD.


Figures

Figure 1.
Figure 1.. A model of KPD incorporating the hypothesis of reversible β-cell deactivation.
Here we illustrate schematically the model described by Eqs. (1–5) (Materials and methods). A: Glucose promotes if nsulin secretion, and insulin lowers glucose, in a negative feedback loop. The effect of insulin on glucose disposal is mediated by the insulin sensitivity SI, and the amount of insulin secreted is proportional to the mass of active beta cells β and the per-cell secretion rate c. This couples these fast dynamics to the slower dynamics in panels B–C. B: Longer timescale dynamics incorporate two distinct types of glucotoxicity. An intermediate scale (days–weeks), reversible glucotoxicity with rate kINg(G) produces an inactive pheonotype βIN, which recovers at rate kRE. Simultaneously, a slower process causes permanent β-cell deactivation or death at rate kDh(G). The dependence of these rates on G couples these processes to those in panel A. C: The per-β-cell secretion rate c adapts to maintain euglycemia, unless c reaches its maximum value cmax. Pink arrows indicate fast (minutes–hours) processes, blue arrows intermediate-rate processes (days–weeks), and green slow processes (months–years).
Figure 2.
Figure 2.. Simulations showing the onset and remission of KPD in our model.
Solid black lines show daily blood glucose averages. Red dashed lines demarcate a period of increased sugar consumption, while blue dashed lines demarcate a period of insulin treatment, if present. Horizontal dotted lines indicate 80 mg / dL (black, typical normoglycemia) and 130 mg / dL (gray, diabetes control threshold per American Diabetes Association). A: With a low rate of reversible β-cell inactivation, blood glucose returns to normal after the period of high sugar consumption. (kRE0.04day1,kIN4.8day1,kD=103day1.) B: With a high rate kIN of reversible β-cell inactivation, the same period of high sugar consumption produces a sharp rise in the blood glucose level, due to a sharp drop in β-cell function (purple curve), which persists after the period of sugar consumption ends. A sufficiently long period of insulin treatment can produce an insulin-free remission. (kIN71day1, other parameters same as A). C: A lower rate kRE of β-cell reactivation, compared to B, increases the time required to produce remission with the same insulin treatment. (kRE0.028day1, other parameters same as B.) D: A higher rate kD of permanent β-cell death, compared to C, results in a failure to achieve insulin-free remission. (kD0.07day1, other parameters same as C). Note that this is due to a permanent loss of β-cell function (purple curve). All model parameters other than those of glucotoxicity and total β-cell mass are fixed at values given in Materials and Methods. Also note that the rate of reversible glucotoxicity is much slower than the value of kIN might suggest, because g(G) is very small at physiological glucose values (e.g., g(100mg/dL)0.0006).
Figure 3.
Figure 3.. Fixed points of the dynamics as a function of sugar intake and exogenous insulin flux
for all other parameter values as in Figure 2(A,B). Gray regions denote negative exogenous fluxes, which are not possible in reality. A1, A2, A3: Regardless of glucose or insulin intake, the non-KPD parameter values give a single steady-state value for glucose (A1) and β (A2, A3). B1, B2: At KPD parameter values, at zero glucose intake, there are two possible stable values for glucose and β, a state with moderate G and high β (blue), and a state with high G and low β (red). Both of these states can stably persist without exogenous glucose or insulin intake. Either a sufficiently large glucose flux (B1, B2) or an (impossible) negative insulin flux (B3) can push the system past a bifurcation (black dashed line), forcing the system into the low-β fixed point. Similarly, a negative glucose intake or sufficiently large insulin treatment pushes the system past a bifurcation, which forces it into the high-β fixed point. Purple dashed lines show the unstable fixed point, which is present in the bistable region.
Figure 4.
Figure 4.. Fixed points as a function of reversible inactivation rate.
All parameters of the model are taken to be as in Figure 2(B), but now the ratio of reversible β-cell inactivation and reactivation rates is varied. As before, red lines denote the hyperglycemic state. A: Fasting glucose as a function of the inactivation rate, showing that there is a range of values over which bistability, and thus KPD-like phenomena, is observed. B: The same phenomena are seen in bistability of the active β-cell fraction.
Figure 5.
Figure 5.. Fixed points as a function of total β-cell population and insulin sensitivity.
All other parameters of the model are taken to be as in Figure 2(A,B). A1, A2: Regardless of insulin sensitivity or total β-cell number, only a single stable value of fasting glucose is possible if the reversible β-cell deactivation rate is low. B1: For a set of parameters which gives bistability, decreasing the total number of β-cells removes the high-β fixed point, producing total insulin dependence. B2: An improvement in insulin sensitivity can push the system past a bifurcation as well, removing the low-β fixed point and thus producing partial remission.
Figure 6.
Figure 6.. Phase diagram of the model
Fixed-point structure of the model as a function of total β-cell population and insulin sensitivity SI, relative to the values used in Fig 2(A,B). Color indicates fasting glucose (with all values of G above 130 mg/dL the same red), while hatching indicates the number of fixed points. No hatching indicates existence of just one stable fixed point at high β and intermediate or normal fasting glucose. Single-hatched regions have two fixed points, allowing for transient loss of β-cell function and remission, while double-hatched regions have only the low-β fixed point (i.e., total insulin dependence). A: For the β-cell inactivation rate as in Fig. 2A, the bistability which produces KPD-like presentation and remission is not seen, even for β-cell populations and SI values which produce fasting hyperglycemia consistent with T2D. B: For the β-cell inactivation rate as in Fig 2B, mild fasting hyperglycemia tends to correspond with a susceptibility to KPD. Reduction of β-cell populations (e.g., due to the slower, permanent glucotoxicity as in 2D) can produce greater hyperglycemia and even total insulin dependence. Improvements in insulin sensitivity, in contrast, contribute to maintenance of remission.
Figure 7.
Figure 7.. Optimal insulin treatment protocol.
Parameters of the model are taken to be those in Figure 2(B), and we determine the optimal treatment protocol under the assumptions that the patient does not consume sugar, and that fasting glucose must not be allowed below some target value Gmin to avoid risk of hypoglycemia. A: The time to achieve remission becomes longer as the target Gmin becomes higher, and remission is never achieved if the target is below the fixed point value. B: The optimal insulin treatment protocol under these assumptions, for Gmin=85,90,95,100 (blue to red).

Similar articles

References

    1. Ader M, Stefanovski D, Kim SP, Richey JM, Ionut V, Catalano KJ, Hucking K, Ellmerer M, Citters GV, Hsu IR, Chiu JD, Woolcott OO, Harrison LN, Zheng D, Lottati M, Kolka CM, Mooradian V, Dittmann J, Yae S, Liu H, et al. Hepatic insulin clearance is the primary determinant of insulin sensitivity in the normal dog. Obesity. 2014; 22(5):1238–1245. doi: 10.1002/oby.20625. - DOI - PMC - PubMed
    1. Alon U. An Introduction to Systems Biology, Design Principles of Biological Circuits. Chapman & Hall/CRC; 2019. doi: 10.1201/9781420011432. - DOI
    1. Banerji MA, Chaiken RL, Lebovitz HE. Long-Term Normoglycemic Remission in Black Newly Diagnosed NIDDM Subjects. Diabetes. 1996; 45(3):337–341. doi: 10.2337/diab.45.3.337. - DOI - PubMed
    1. Bergman RN, Ider YZ, Bowden CR, Cobelli C. Quantitative estimation of insulin sensitivity. American Journal of Physiology-Endocrinology and Metabolism. 1979; 236(6):E667. doi: 10.1152/ajpendo.1979.236.6.e667. - DOI - PubMed
    1. CDC. Centers for Disease Control and Prevention. National Diabetes Statistics Report, 2020. Atlanta, GA; 2020.

Publication types