[Preprint]. 2024 Dec 3:2024.06.07.597998.
doi: 10.1101/2024.06.07.597998.

Protein absorption in the zebrafish gut is regulated by interactions between lysosome rich enterocytes and the microbiome

Affiliations

Protein absorption in the zebrafish gut is regulated by interactions between lysosome rich enterocytes and the microbiome

Laura Childers et al. bioRxiv. .

Update in

Abstract

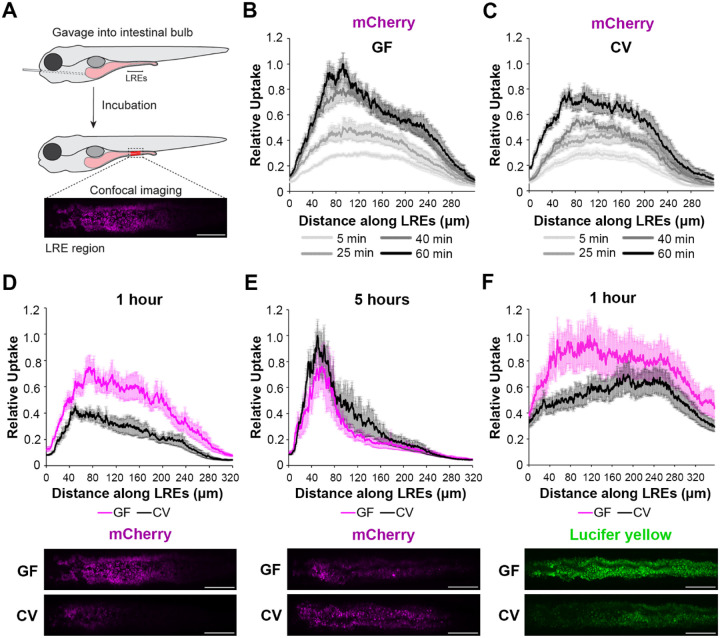
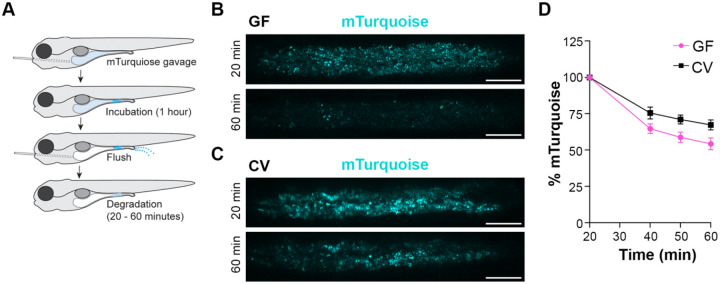
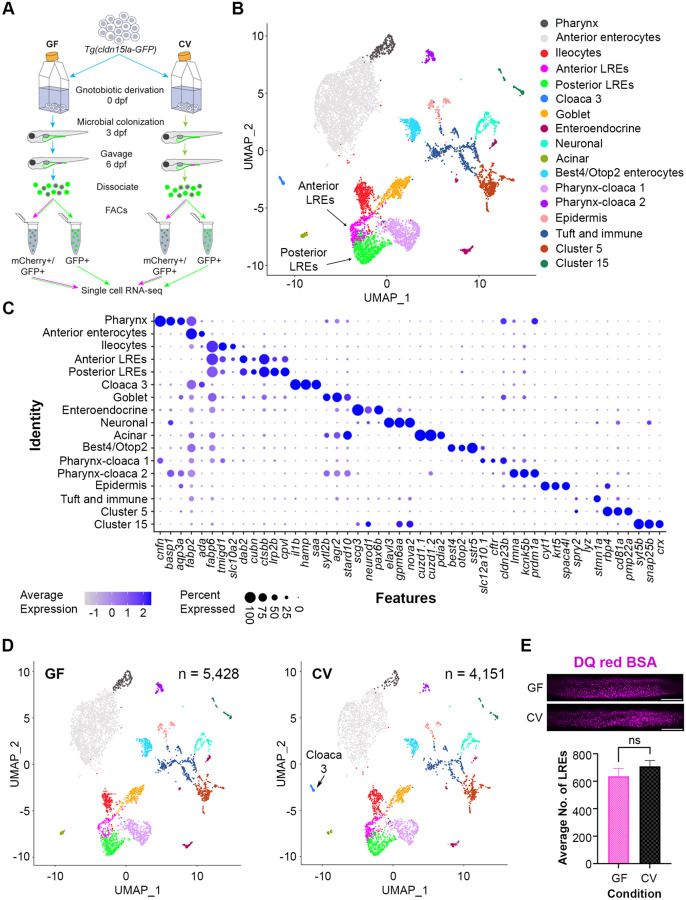
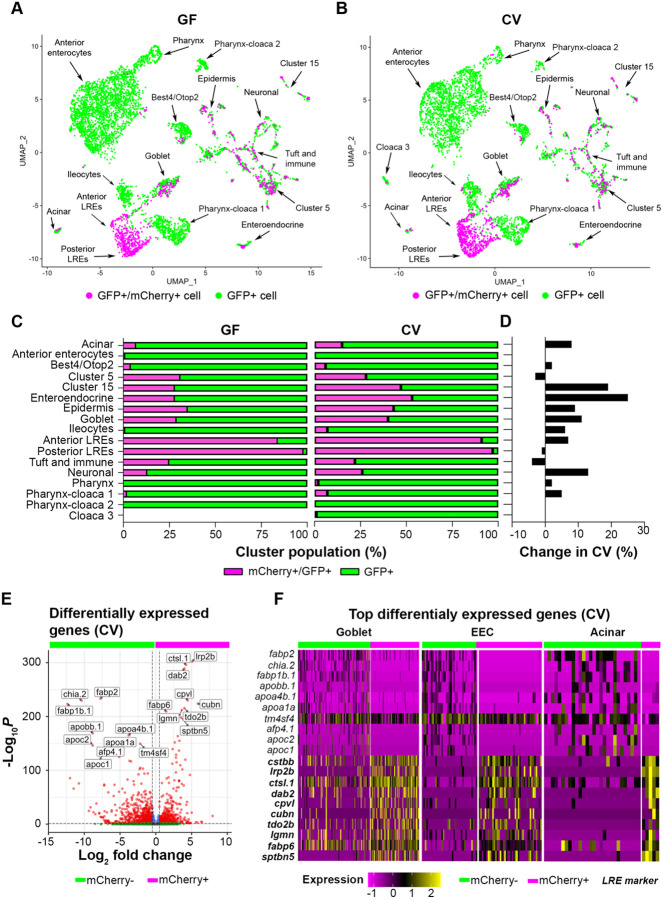
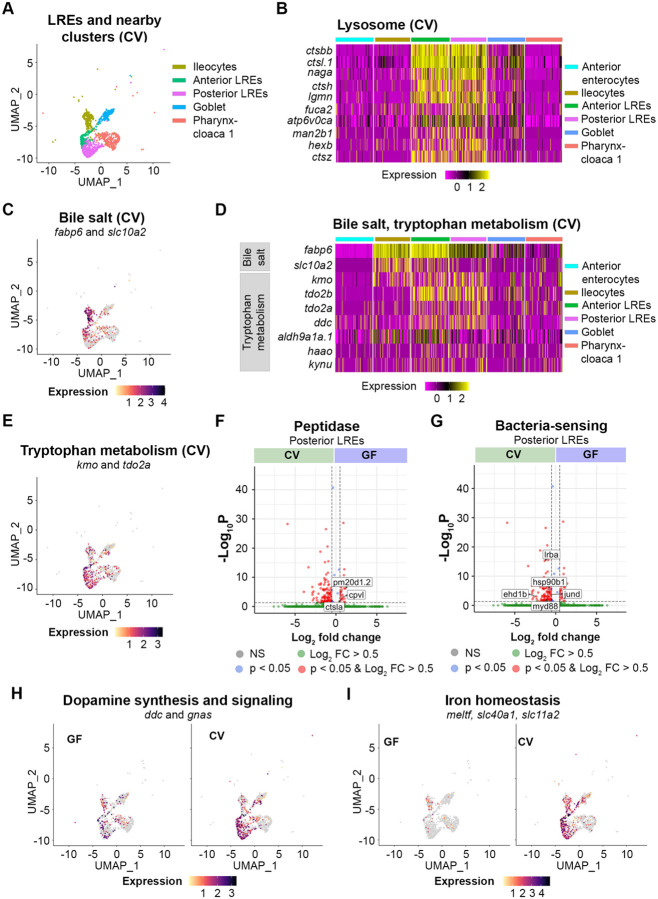
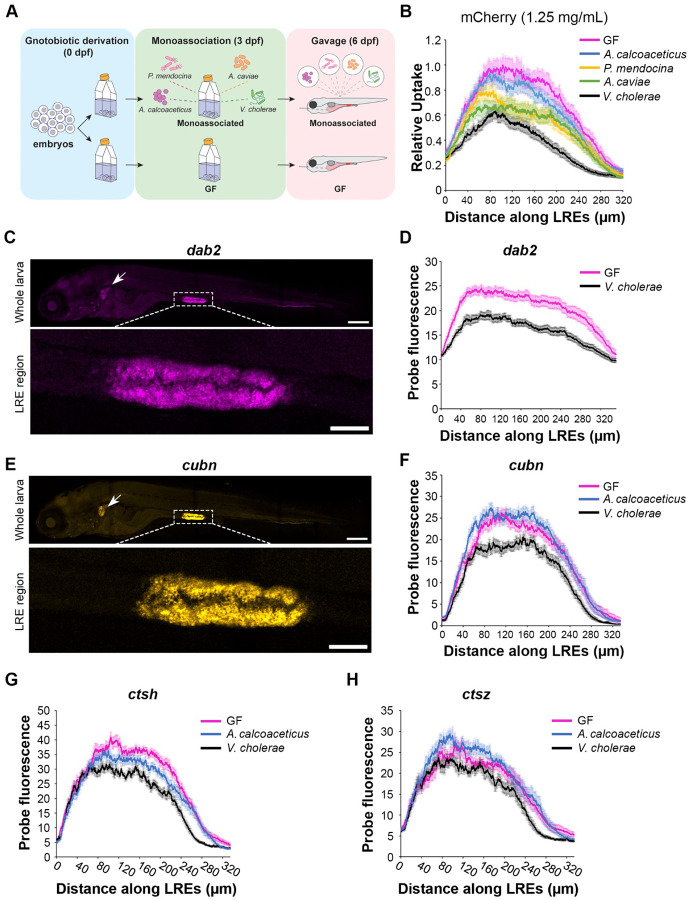
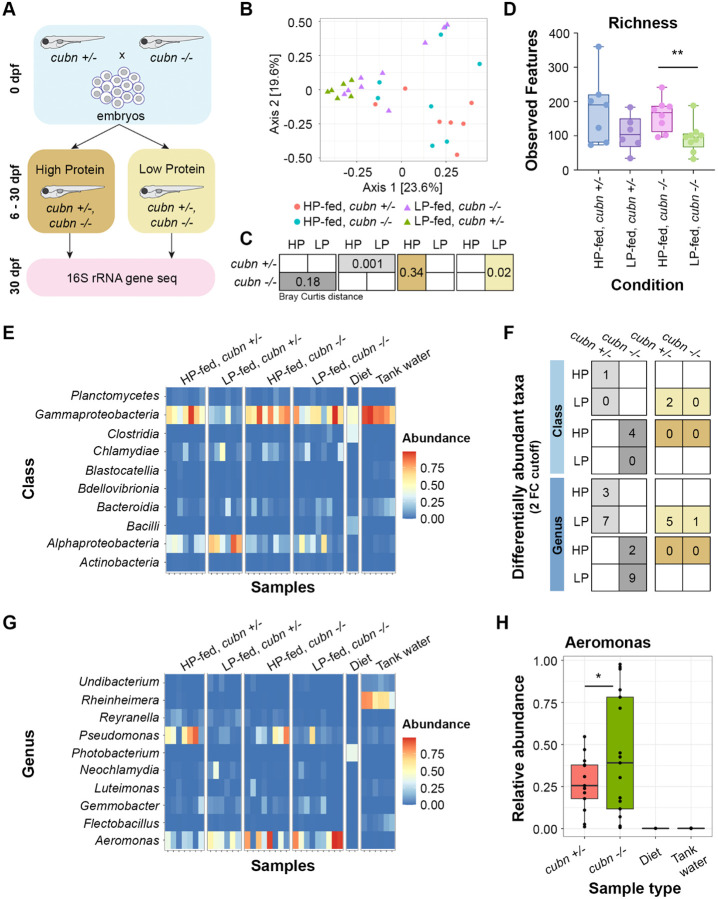
Dietary protein absorption in neonatal mammals and fishes relies on the function of a specialized and conserved population of highly absorptive lysosome rich enterocytes (LREs). The gut microbiome has been shown to enhance absorption of nutrients, such as lipids, by intestinal epithelial cells. However, whether protein absorption is also affected by the gut microbiome is poorly understood. Here, we investigate connections between protein absorption and microbes in the zebrafish gut. Using live microscopy-based quantitative assays, we find that microbes slow the pace of protein uptake and degradation in LREs. While microbes do not affect the number of absorbing LRE cells, microbes lower the expression of endocytic and protein digestion machinery in LREs. Using transgene assisted cell isolation and single cell RNA-sequencing, we characterize all intestinal cells that take up dietary protein. We find that microbes affect expression of bacteria-sensing and metabolic pathways in LREs, and that some secretory cell types also take up protein and share components of protein uptake and digestion machinery with LREs. Using custom-formulated diets, we investigated the influence of diet and LRE activity on the gut microbiome. Impaired protein uptake activity in LREs, along with a protein-deficient diet, alters the microbial community and leads to increased abundance of bacterial genera that have the capacity to reduce protein uptake in LREs. Together, these results reveal that diet-dependent reciprocal interactions between LREs and the gut microbiome regulate protein absorption.


Figures

Figure 1.
Figure 1.. Microbes slow the rate of soluble cargo uptake in LREs.
(A) Cartoon depicting experimental design of the gavage assay in GF and CV larvae. Following derivation under conventional (CV) or germ-free (GF) conditions, 6 dpf larvae were gavaged, and uptake of luminal cargoes by LREs was measured by confocal microscopy in the LRE region (approximately 300 μm in length). (B, C) Plots of normalized mCherry fluorescence intensity along the LRE region over time in 6 dpf GF (B) and CV (C) larvae. Minutes after gavage, LREs rapidly took up and quickly accumulate mCherry in GF larvae. The anterior LREs approached full saturation by 40 minutes post gavage. Cargo uptake was slower in CV larvae, and anterior LREs did not reach saturation by 40 minutes post gavage. (D, E) Top: Plots of normalized mCherry fluorescence intensity along the LRE region of GF and CV larvae at 1 (D) and 5 (E) hours PG. GF larvae internalized significantly more mCherry than CV larvae (2-way ANOVA, p < 0.0001, n = 8 – 10) one hour PG, and CV larvae reached a similar level of mCherry accumulation to GF larvae by 5 hours PG (2-way ANOVA, p = 0.137, n = 8 – 11). Bottom: Representative confocal images showing mCherry signal in the LRE region (scale bars = 50 μm). (F) Top: Plot of normalized lucifer yellow fluorescence intensity along the LRE region of GF and CV larvae at 1 hour post gavage. LREs in GF larvae internalized significantly more Lucifer yellow than CV larvae by 1 hour post gavage (2-way ANOVA, p < 0.0001, n = 8).
Figure 2.
Figure 2.. LRE protein degradation activity is reduced by microbes.
(A) Cartoon depicting the experimental design of pulse-chase protein uptake and degradation assay. At 6 dpf, GF and CV larvae were gavaged with mTurquoise (25 mg/mL), incubated for 1 hour, and then flushed with PBS to remove luminal mTurquoise. LRE degradation of mTurquoise was measured by confocal microscopy over time. (B, C) Confocal images of mTurquoise fluorescence in the LRE region after flushing in GF (B) and CV (C) larvae (scale bars = 50 μm). (D) Plot showing the degradation of mTurquoise fluorescence (%) in the LRE region over time. Degradation occurred at a significantly faster rate in GF than CV larvae from 20 – 60 minutes post gavage (Simple linear regression, p = 0.0167, n = 6).
Figure 3.
Figure 3.. Single cell clustering reveals anterior and posterior LREs, microbially-responsive cloaca cells.
(A) Cartoon depicting experimental design for transcriptomic profiling of intestinal cells in GF and CV larvae. GF and CV larvae expressing Tg(cldn15la-GFP) to label all intestinal epithelial cells (IECs) were raised to 6 dpf in gnotobiotic conditions and then gavaged with mCherry (1.25 mg/mL). Cells from dissociated larvae were FACs sorted to isolate GFP-positive/mCherry-positive from GFP-positive/mCherry-negative populations prior to single cell sequencing. (B) UMAP projection of cells color coded by cluster identity. (C) Dot plot of top cluster markers in each cluster. Average expression of the marker gene in each cell cluster is signified by the color gradient. Dot size indicates the percentage of cells in each cluster expressing the marker. (D) UMAP projection of cells color coded by cluster identity in the GF (left) and CV (right) datasets. The Cloaca 3 cluster only appeared in the CV dataset. (E) Bar plot showing that the average number of LREs in the GF and CV larvae was not significantly different (2-tailed t-test, p = 0.33, n = 10). LREs were labeled by gavaging with DQ red BSA (50 μg/mL) in a separate experiment, then quantified. Images show DQ red BSA marking LRE lysosomal vacuoles (scale bar = 50 μm).
Figure 4.
Figure 4.. Uptake of mCherry occurs in cells enriched in LRE markers.
(A, B) UMAP projections highlighting mCherry-positive/GFP-positive cells (magenta) and GFP-positive cells (green) in the GF and CV datasets. (C) Bar plots portray the percentage of mCherry-positive and mCherry-negative cells in the GF and CV datasets. Bar color indicates the proportion of mCherry-positive (magenta) and mCherry-negative (green) cells in each cluster. (D) Bar plot displays the difference in the proportion of mCherry-positive cells in the CV compared to the GF dataset. Positive values show that the proportion of mCherry-positive cells were higher in the CV dataset. (E) Volcano plot shows differentially expressed genes between mCherry-positive and mCherry-negative cells in the CV dataset. The x-axis displays the log fold change in expression between mCherry-positive and mCherry-negative cells, with positive values showing enhanced expression in mCherry-positive cells and negative values showing higher expression in mCherry-negative cells. Red points are genes with significantly different expression (padj < 0.05) and high fold change (log2FC < − 0.05, log2FC > 0.05). (F) Heatmap displays the expression of the top markers for mCherry-positive and mCherry-negative cells in goblet, EEC and acinar clusters. The color bar at the top indicates mCherry-positive (magenta) and mCherry-negative (green) cell types. Expression level is highlighted with a color gradient. mCherry-positive cells showed higher expression of dab2 and other LRE enriched endocytic markers (bolded), whereas mCherry-negative cells express typical anterior enterocyte markers such as fabp2.
Figure 5.
Figure 5.. Transcriptomic patterns of anterior and posterior LREs.
(A) UMAP projection shows anterior and posterior LREs, as well as close cell clusters in the CV condition. Cell types are color coded. (B) Heatmap illustrates expression of lysosome KEGG pathway genes in LREs and close clusters. The colored bars at the top of the plot indicate the cluster. Heatmap color corresponds to expression intensity. (C) UMAP projection displays expression of the bile salt transport genes fabp6 and slc10a2 in the LREs, ileocytes, goblet and pharynx-cloaca 1 cells. Cell color indicates cumulative expression intensity for fabp6 and slc10a2. (D) Heatmap highlights expression of bile salt transport and tryptophan metabolism genes in the LREs and close clusters. The colored bars at the top indicate the cell cluster. (E) UMAP projection displays expression of tryptophan metabolism genes kmo and tdo2a in the LREs and close clusters. Cell color indicates cumulative expression intensity of kmo and tdo2a. (F) Volcano plot shows DEGs between GF and CV posterior LREs. Peptidase genes are tagged. (G) Volcano plot shows DEGs between GF and CV posterior LREs. Genes involved in microbe sensing and inflammatory response are tagged. (H) UMAP projection plots show expression of dopamine synthesis (ddc) and signaling (gnas) genes in GF (left) and CV (right) cells. (I) UMAP projection plots show expression of iron homeostasis genes (meltf, slc40a1, slc11a2) in GF (left) and CV (right) cells.
Figure 6.
Figure 6.. LRE activity and expression of endocytic machinery are differentially affected by individual microbial strains.
(A) Cartoon of monoassociation experimental design. Following gnotobiotic derivation, monoassociated larvae are colonized with a single strain of bacteria at 3 dpf and gavaged with mCherry to measure protein uptake at 6 dpf. (B) Plot shows relative uptake of mCherry in larvae that were GF or monoassociated with a single bacterial strain. mCherry uptake was reduced by A. calcoaceticus (2-way ANOVA, p = 0.0268, n = 19 – 20), P. mendocina (2-way ANOVA, p = 0.0033, n = 20 – 21), A. caviae (2-way ANOVA, p < 0.0001, n = 19 – 20) and V. cholerae (2-way ANOVA, p < 0.0001, n = 18 – 20). (C) Confocal images show dab2 HCR probe localization in whole zebrafish larva (top) and LRE region (bottom). Arrow points to pronephros. Whole larva scale = 200 μm. LRE region scale = 50 μm. (D) Plot shows dab2 HCR probe fluorescence in the LRE region at 6 dpf. dab2 expression was significantly greater in GF than V. cholerae-colonized larvae (2-way ANOVA, p < 0.0001, n = 23). (E) Confocal images show cubn HCR probe localization in whole zebrafish larva (top) and LRE region (bottom). Arrow points to pronephros. Whole larva scale = 200 μm. LRE region scale = 50 μm. (F) Plot shows cubn HCR probe fluorescence in the LRE region at 6 dpf. There was greater cubn expression in A. calcoaceticus-colonized than GF larvae (2-way ANOVA, p = 0.049, n = 21 – 23), but V. cholerae significantly reduced cubn expression (2-way ANOVA, p < 0.0001, n = 16 – 23). (G) Plot of ctsh expression in GF and monoassociated larvae. GF larvae showed greater ctsh expression than A. calcoaceticus (2-way ANOVA, p = 0.0183, n = 10 – 12) or V. cholerae-colonized larvae (2-way ANOVA, p < 0.0001, n = 8 – 12). (H) Plot of ctsz expression in GF and monoassociated larvae. A. calcoaceticus and GF larvae showed similar levels of ctsz expression in LREs (2-way ANOVA, p = 0.09, n= 10 – 12). V. cholerae colonization reduced ctsz expression compared to GF larvae (2-way ANOVA, p = 0.0014, n = 8 – 12).
Figure 7.
Figure 7.. LRE activity and dietary protein impact gut microbiome.
(A) Cartoon of 16S rRNA gene sequencing experimental design. Homozygous cubn mutant and heterozygote larvae from the same clutch were fed a HP or LP diet from 6 to 30 dpf prior to whole larvae DNA extraction. (B) MDS plot of Bray Curtis distance between zebrafish samples. (C) Boxes show Bray Curtis distance p-values comparing genotype and diet effects on beta diversity. (D) Box plot of observed features between conditions. (E) Heat map of classes with the highest relative abundance across all samples. (F) Table of differentially abundant taxa counts at the class and genus levels. Boxes show the number of differentially abundant taxa per compared condition. Dietary comparisons are in the left column. Genotype comparisons are in the right column. (G) Heat map of the genera with the highest relative abundance across all samples. (H) Box plot showing relative abundance of Aeromonas spp. across genotypes and controls. The relative abundance of Aeromonas spp. was significantly higher in cubn mutants than heterozygotes (DESeq2, padj = 0.01).

References

    1. Ahuja Malini, Schwartz Daniella M., Tandon Mayank, Son Aran, Zeng Mei, Swaim William, Eckhaus Michael, et al. 2017. “Orai1-Mediated Antimicrobial Secretion from Pancreatic Acini Shapes the Gut Microbiome and Regulates Gut Innate Immunity.” Cell Metabolism 25 (3): 635–46. 10.1016/j.cmet.2017.02.007. - DOI - PMC - PubMed
    1. Alvers Ashley L., Ryan Sean, Scherz Paul J., Huisken Jan, and Bagnat Michel. 2014. “Single Continuous Lumen Formation in the Zebrafish Gut Is Mediated by Smoothened-Dependent Tissue Remodeling.” Development (Cambridge) 141 (5): 1110–19. 10.1242/dev.100313. - DOI - PMC - PubMed
    1. Bao Honghong, Wang Yi, Xiong Hanlin, Xia Yaoyao, Cui Zhifu, and Liu Lingbin. 2024. “Mechanism of Iron Ion Homeostasis in Intestinal Immunity and Gut Microbiota Remodeling.” International Journal of Molecular Sciences. Multidisciplinary Digital Publishing Institute (MDPI). 10.3390/ijms25020727. - DOI - PMC - PubMed
    1. Yasmine Belkaid, and Hand Timothy W. 2014. “Role of the Microbiota in Immunity and Inflammation.” Cell 157: 121–41. 10.1016/j.cell.2014.03.011. - DOI - PMC - PubMed
    1. Bessede Alban, Gargaro Marco, Pallotta Maria T., Matino Davide, Servillo Giuseppe, Brunacci Cinzia, Bicciato Silvio, et al. 2014. “Aryl Hydrocarbon Receptor Control of a Disease Tolerance Defence Pathway.” Nature 511 (7508): 184–90. 10.1038/nature13323. - DOI - PMC - PubMed

Publication types