

This is a preprint.
Single-cell heterogeneity in ribosome content and the consequences for the growth laws
- PMID: 38895328
- PMCID: PMC11185559
- DOI: 10.1101/2024.04.19.590370
Single-cell heterogeneity in ribosome content and the consequences for the growth laws
Abstract
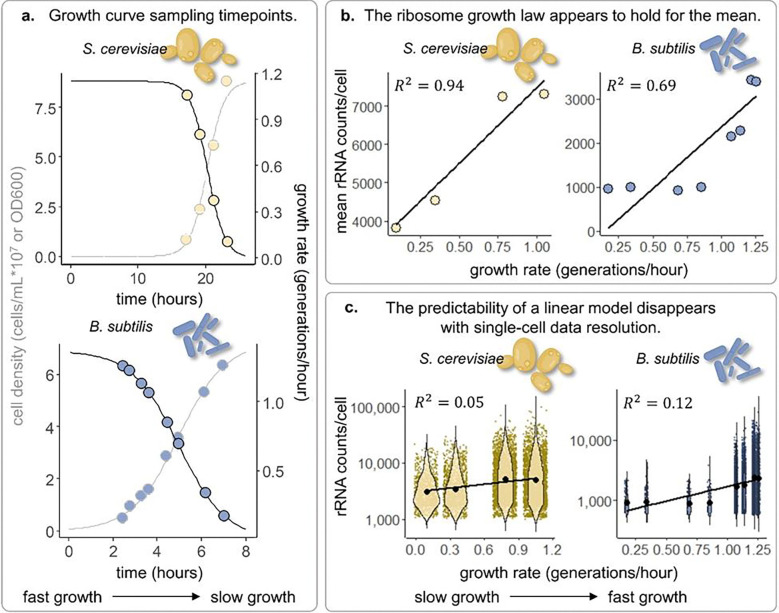
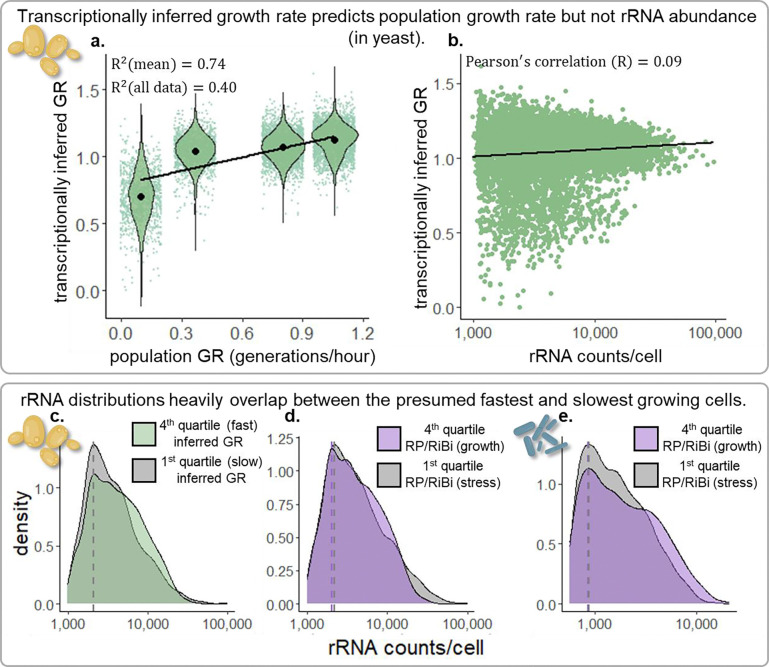
Across species and environments, the ribosome content of cell populations correlates with population growth rate. The robustness and universality of this correlation have led to its classification as a "growth law." This law has fueled theories about how evolution selects for microbial organisms that maximize their growth rate based on nutrient availability, and it has informed models about how individual cells regulate their growth rates and ribosomal content. However, due to methodological limitations, this growth law has rarely been studied at the level of individual cells. While populations of fast-growing cells tend to have more ribosomes than populations of slow-growing cells, it is unclear whether individual cells tightly regulate their ribosome content to match their environment. Here, we employ recent groundbreaking single-cell RNA sequencing techniques to study this growth law at the single-cell level in two different microbes, S. cerevisiae (a single-celled yeast and eukaryote) and B. subtilis (a bacterium and prokaryote). In both species, we observe significant variation in the ribosomal content of single cells that is not predictive of growth rate. Fast-growing populations include cells exhibiting transcriptional signatures of slow growth and stress, as do cells with the highest ribosome content we survey. Broadening our focus to non-ribosomal transcripts reveals subpopulations of cells in unique transcriptional states suggestive that they have evolved to do things other than maximize their rate of growth. Overall, these results indicate that single-cell ribosome levels are not finely tuned to match population growth rates or nutrient availability and cannot be predicted by a Gaussian process model that assumes measurements are sampled from a normal distribution centered on the population average. This work encourages the expansion of growth law and other models that predict how growth rates are regulated or how they evolve to consider single-cell heterogeneity. To this end, we provide extensive data and analysis of ribosomal and transcriptomic variation across thousands of single cells from multiple conditions, replicates, and species.
Figures


Similar articles
-
Environment-specificity and universality of the microbial growth law.Commun Biol. 2022 Aug 31;5(1):891. doi: 10.1038/s42003-022-03815-w. Commun Biol. 2022. PMID: 36045217 Free PMC article.
-
Implications of rRNA operon copy number and ribosome content in the marine oligotrophic ultramicrobacterium Sphingomonas sp. strain RB2256.Appl Environ Microbiol. 1998 Nov;64(11):4433-8. doi: 10.1128/AEM.64.11.4433-4438.1998. Appl Environ Microbiol. 1998. PMID: 9797303 Free PMC article.
-
The layered costs and benefits of translational redundancy.Elife. 2023 Mar 2;12:e81005. doi: 10.7554/eLife.81005. Elife. 2023. PMID: 36862572 Free PMC article.
-
Promising Assays for Examining a Putative Role of Ribosomal Heterogeneity in COVID-19 Susceptibility and Severity.Life (Basel). 2022 Jan 28;12(2):203. doi: 10.3390/life12020203. Life (Basel). 2022. PMID: 35207490 Free PMC article. Review.
-
Towards an elucidation of the roles of the ribosome during different growth phases in Bacillus subtilis.Biosci Biotechnol Biochem. 2010;74(3):451-61. doi: 10.1271/bbb.90859. Epub 2010 Mar 7. Biosci Biotechnol Biochem. 2010. PMID: 20208344 Review.
References
-
- Lynch M. (2022). Evolutionary Scaling Laws in Cell Biology. In Evolutionary Cell Biology: The Origins of Cellular Architecture.
-
- Lynch M. (2023). Cell Growth and Division. In Evolutionary Cell Biology: The Origins of Cellular Architecture.
-
- Golan O., Hindley H., de Jong H., Köbis M., Pascual Garcia E., and Weiße A. (2024). Models of growing cells. In Economic Principles in Cell Biology The Economic Cell Collective., pp. 117–134.
-
- Kremling A., Liebermeister W., Noor E., and Wortel M. (2024). Metabolism in states of maximal enzyme efficiency. In Economic Principles in Cell Biology The Economic Cell Collective., pp. 107–116.
Publication types
Grants and funding
LinkOut - more resources
Full Text Sources
Molecular Biology Databases