[Preprint]. 2024 Jun 9:2024.06.08.598009.
doi: 10.1101/2024.06.08.598009.

Evidence of RNA polymerase III recruitment and transcription at protein-coding gene promoters

Affiliations

Evidence of RNA polymerase III recruitment and transcription at protein-coding gene promoters

K C Rajendra et al. bioRxiv. .

Update in

Abstract

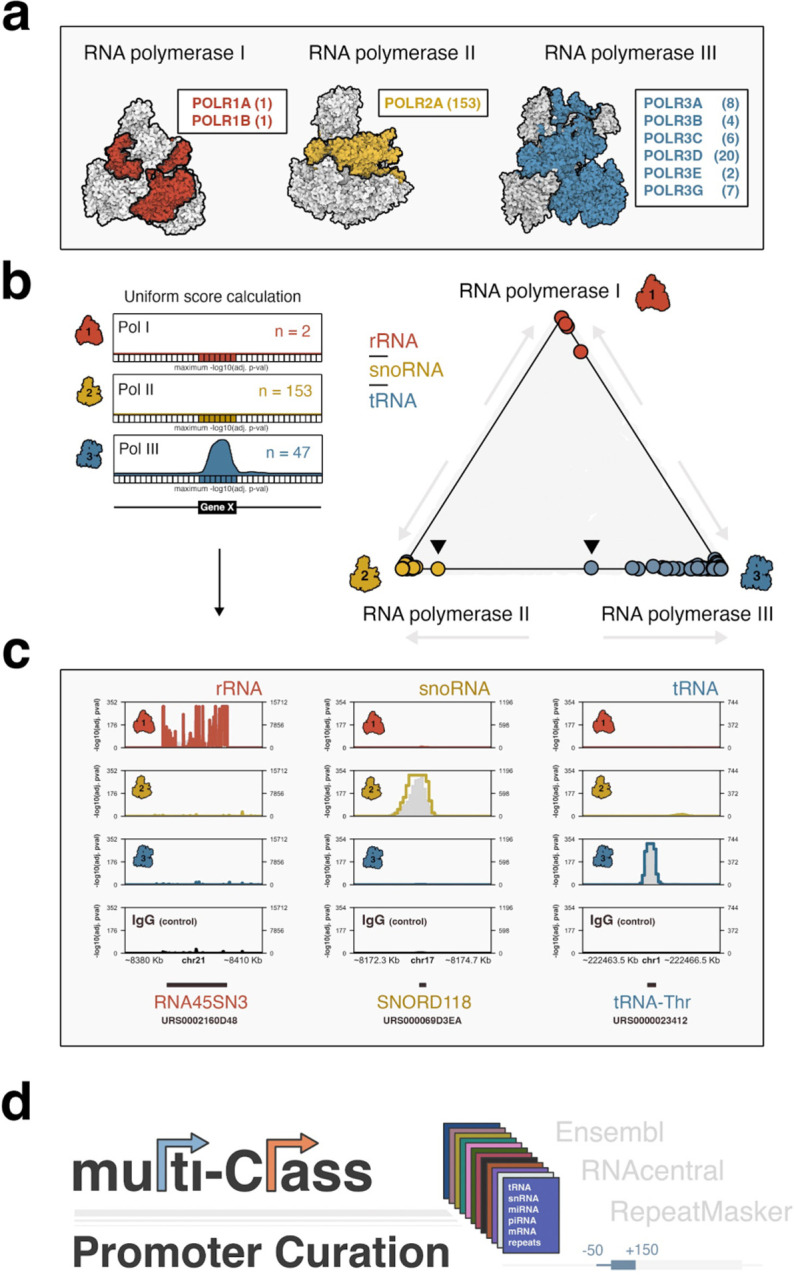
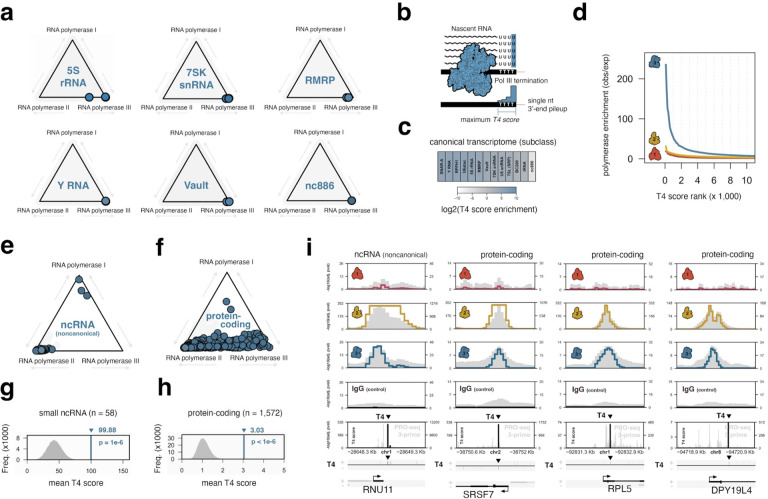
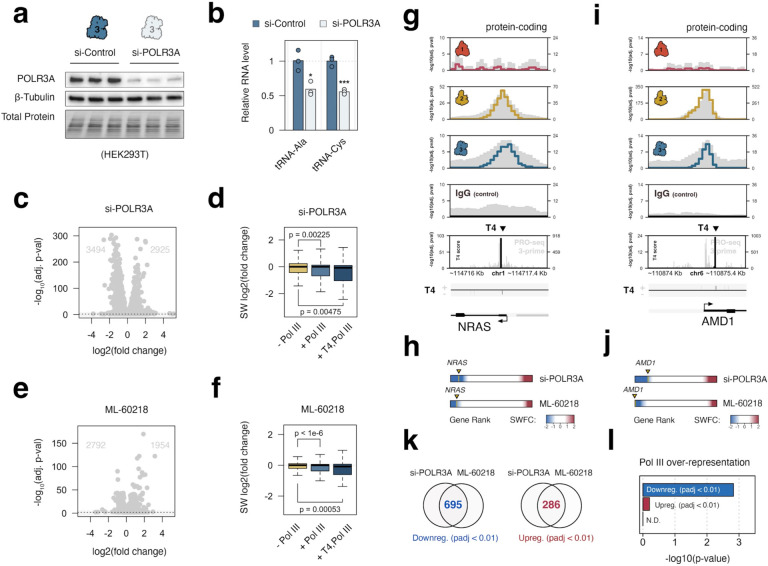
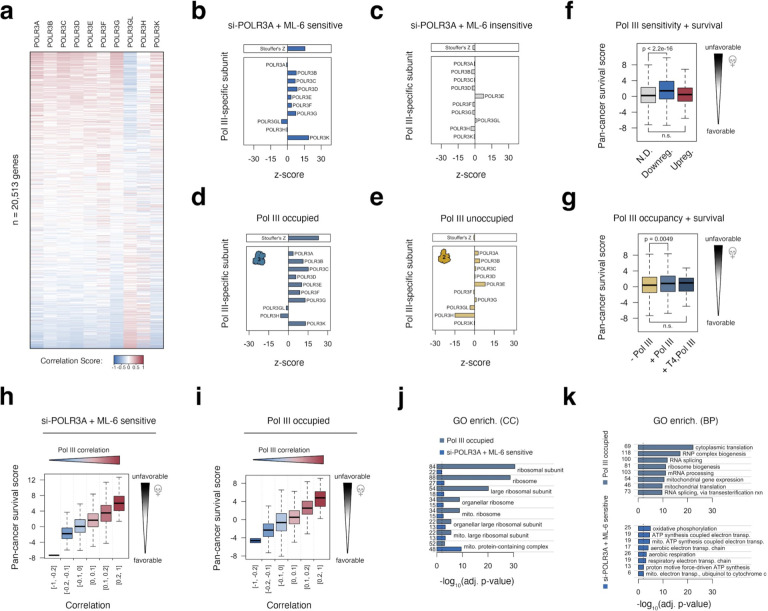
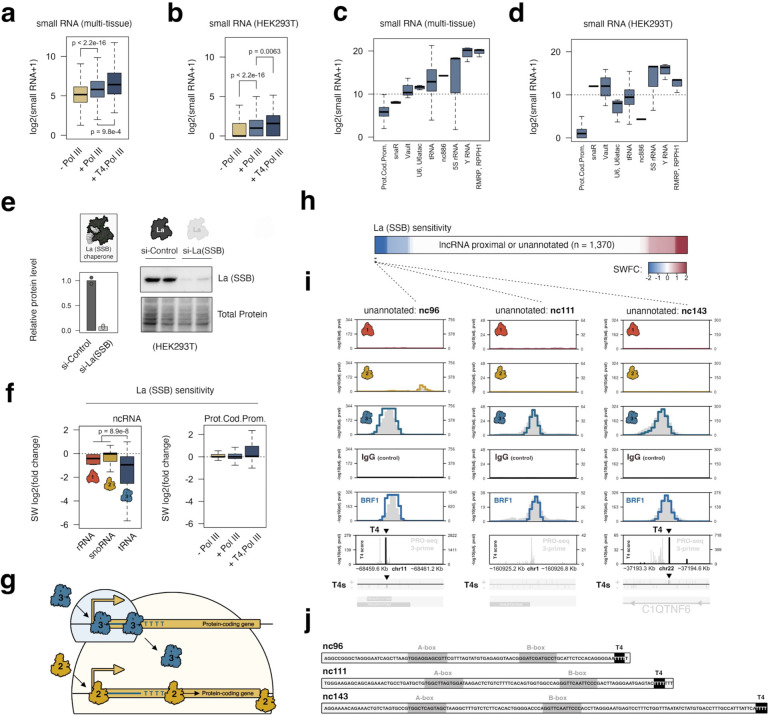
RNA polymerase (Pol) I, II, and III are most commonly described as having distinct roles in synthesizing ribosomal RNA (rRNA), messenger RNA (mRNA), and specific small noncoding (nc)RNAs, respectively. This delineation of transcriptional responsibilities is not definitive, however, as evidenced by instances of Pol II recruitment to genes conventionally transcribed by Pol III, including the co-transcription of RPPH1 - the catalytic RNA component of RNase P. A comprehensive understanding of the interplay between RNA polymerase complexes remains lacking, however, due to limited comparative analyses for all three enzymes. To address this gap, we applied a uniform framework for quantifying global Pol I, II, and III occupancies that integrates currently available human RNA polymerase ChIP-seq datasets. Occupancy maps are combined with a comprehensive multi-class promoter set that includes protein-coding genes, noncoding genes, and repetitive elements. While our genomic survey appropriately identifies recruitment of Pol I, II, and III to canonical target genes, we unexpectedly discover widespread recruitment of the Pol III machinery to promoters of specific protein-coding genes, supported by colocalization patterns observed for several Pol III-specific subunits. We show that Pol III-occupied Pol II promoters are enriched for small, nascent RNA reads terminating in a run of 4 Ts, a unique hallmark of Pol III transcription termination and evidence of active Pol III activity at these sites. Pol III disruption differentially modulates the expression of Pol III-occupied coding genes, which are functionally enriched for ribosomal proteins and genes broadly linked to unfavorable outcomes in cancer. Our map also identifies additional, currently unannotated genomic elements occupied by Pol III with clear signatures of nascent RNA species that are sensitive to disruption of La (SSB) - a Pol III-related RNA chaperone protein. These findings reshape our current understanding of the interplay between Pols II and III and identify potentially novel small ncRNAs with broad implications for gene regulatory paradigms and RNA biology.


Conflict of interest statement

Competing interest statement The authors declare no competing interests

Figures

Figure 1.
Figure 1.. Genome-wide survey of human RNA polymerase binding patterns.
(a) Illustrative overview of Pol I, II, and III complexes, coloring and labels correspond to individual subunits mapped by ChIP-seq. (b) Application of a uniform scoring framework (left) for composite Pol I, II, and III ChIP-seq signals. Pol occupancy scores are defined globally across 50 bp bins by assigning adjusted Poisson probabilities determined against maximum, bin-specific lambda scores. Global Pol scoring recovers canonical polymerase-gene dominance at rRNA (Pol I), snoRNA (Pol II), and tRNA (Pol III). (c) Specific examples of Pol I dominance at ribosomal RNA genes (RNA45SN3, left), Pol II dominance at snoRNA genes (SNORD118, center), and Pol III dominance at tRNA genes (tRNA-Thr, right). (d) Coding, noncoding, and repeat annotations were integrated into a multi-class promoter set, defined as a window 50 bp upstream to 150 downstream of transcription start sites, for global scoring of polymerase occupancies.
Figure 2.
Figure 2.. Discovery of RNA polymerase III occupancy and transcription termination signatures at noncanonical loci, including protein-coding gene promoters.
(a) Analysis of polymerase signal dominance at specific subclasses of Pol III-transcribed genes, including 5S rRNA, 7SK snRNA, RMRP, Y RNA, Vault, and nc886. (b) Illustrative overview of Pol III termination, which occurs at a run of 4–6 Thymidine (T) sequences. T4 scoring of 3’-single nucleotide pileup in nascent RNA is used as a molecular readout of Pol III transcription termination. (c) T4 score enrichment for specific Pol III-transcribed gene subclasses, with respect to all sites with significant Pol III occupancy (padj < .05). (d) Pol I, II, and III signal enrichment at gene promoters, ranked by maximum T4 scores present within 350 bp of a given transcription start site. (e) RNA polymerase dominance plot for small noncoding RNA genes not previously defined as Pol III-transcribed but characterized by significant Pol III occupancy in our metamap. (f) Analogous dominance plot for protein-coding genes with significant Pol III occupancy. (g-h) Observations and corresponding empirical null distributions for T4 scores at noncanonical small RNA genes (related to Figure 2e) and protein-coding gene promoters (related to Figure 2f). (i) Visualization of Pol I, II, IIII occupancies at RNU11 - a small ncRNA gene canonically expressed by Pol II - and multiple protein-coding genes, including SRSF7, RPL5, and DPY19L4. All genes are defined as having significant Pol III occupancy and T4 score enrichment. Significant T4 score peaks are highlighted.
Figure 3.
Figure 3.. Pol III-occupied protein-coding gene promoters are sensitive to Pol III depletion and inhibition.
(a) Immunoblot analysis POLR3A (RPC1) and beta-Tubulin protein levels in control (scramble) and POLR3A siRNA conditions in HEK293T cells. (b) RT-qPCR analysis of the relative change in Pol III-transcribed tRNA levels following siRNA-mediated reduction in HEK293T. (c) Differential expression profile for protein coding genes, including the number of up- and down-regulated genes (FDR < 0.05 and abs(Log2FC > 1) following disruption of POLR3A. (d) Distributions of significance-weighted fold change scores for protein-coding genes without Pol III, with Pol III, or with both Pol III and significant T4 scores. (e) Differential expression profile for protein coding genes, including the number of up- and down-regulated genes (FDR < 0.05 and abs(Log2FC > 1) following Pol III inhibition with small molecule ML-60218. (f) Distributions of significance-weighted fold change scores for protein-coding genes without Pol III, with Pol III, or with both significant Pol III and T4 scores, following Pol III inhibition with small molecule ML-60218. (g-h) Specific example of shared Pol II and Pol III occupancy at a protein-coding gene NRAS (g) which is highly sensitive to Pol III disruption (h), either through depletion of POLR3A or through inhibition of Pol III with ML-60218. (i-j) Additional example of Pol III occupancy (i) and and Pol III sensitivity (j) at protein-coding gene AMD1. (k) Total number of shared differentially down-(blue) and upregulated genes (red) following si-POLR3A or ML-60218 (padj < 0.01). (l) Overlap enrichment of Pol III occupancy at down-, up-, and nondifferential (N.D.) gene sets
Figure 4.
Figure 4.. Expression of Pol III-sensitive and Pol III-occupied protein-coding genes is broadly linked with Pol III subunit expression and unfavorable outcomes in cancer.
(a) Heatmap visualization of gene expression correlation scores for > 20,000 genes, ranked by the median correlation with Pol III-specific subunits. (b-c) Analysis of subunit-specific correlation features for genes downregulated in response to both si-POLR3A and ML-60218 experiments (b), and genes that are non-differential in both experiments (c). Barplots illustrate the strength and direction of correlation between a given gene set and genes encoding individual Pol III subunits, benchmarked against empirical null distributions. A summary z-score, calculated using Stouffer’s method, is represented at the top. (d-e) Analogous comparison of subunit-specific correlation features for Pol III occupied (d) and Pol III unoccupied (e) protein-coding genes. (f) Distributions of pan-cancer survival statistics related to the expression of genes that are nondifferential (N.D.), downregulated by both si-POLR3A and ML-60218 (downreg.), or upregulated in both conditions (upreg.). Survival statistics were retrieved from tcga-survival.com. (g) Distributions of pan-cancer survival statistics related to the expression of genes that Pol III unoccupied (− Pol III), Pol III occupied (+ Pol III), or Pol III occupied with T4 signatures (+ T4, Pol III). (h-i) Distributions of pan-cancer survival statistics related to the expression of genes as a function of its median correlation with Pol III-specific subunits (related to a) for Pol III-sensitive (h) or Pol III-occupied (i) genes. (j) Gene ontology (GO) enrichment analysis for cellular component (CC) terms significant (FDR < 0.05) in both Pol III-sensitive and Pol III-occupied gene sets. (k) Enriched biological process (BP) GO terms for Pol III-sensitive (top) and Pol III-occupied (bottom) gene sets.
Figure 5.
Figure 5.. Depletion of RNA chaperone protein La (SSB) rules out the production of stable, promoter-derived small RNAs, but otherwise reveals multiple La-sensitive ncRNA species produced by RNA polymerase III at currently unannotated loci.
(a) Distributions of multi-tissue small RNA levels mapped to Pol III-unoccupied (− Pol III), Pol III-occupied (+ Pol III), or Pol III-occupied protein-coding gene promoters with significant T4 enrichment (+T4, Pol III). (b) Analogous distributions of small RNA abundance linked to specific protein-coding promoters in HEK293T cells, which are sensitive to si-POLR3A and ML-60218 treatments. (c) Distributions of multi-tissue small RNA levels mapped to Pol III occupied protein-coding genes, compared to canonical Pol III-transcribed gene classes. (d) Analogous distributions of small RNA levels in HEK293T cells. (e) Immunoblot and quantification of RNA chaperone protein La following siRNA depletion in HEK293T cells. (f) Significance-weighted (SW) log2(fold change) of 45S pre-rRNAs, snoRNAs, and tRNAs following depletion of La (left), and of small RNAs mapped to protein-coding gene promoters of varying Pol III occupancy signatures. (g) Model: recruitment of Pol III to protein-coding genes results in transcription that terminates at T4 sequences, typically a short distance from the transcription start site, in contrast to processive transcription by Pol II. Pol III activity functionally enhances Pol II, but does not generate stable, promoter-derived small RNAs. (h) Heatmap visualization of La sensitivity for small RNAs from currently unannotated or lncRNA-proximal loci with significant Pol III signatures. (i) Examples of La-sensitive intervals with genomic indicators of Pol III activity. (j) Candidate sequence elements, related to 5i, on the basis of La-sensitivity, Pol III localization, and small RNA reads mapping to individual regions. Putative A-box, B-box, and termination sequence elements are highlighted.

Similar articles

References

    1. Sentenac A. Eukaryotic RNA Polymerase. Crit. Rev. Biochem. 18, 31–90 (1985). - PubMed
    1. Turowski T. W. & Boguta M. Specific Features of RNA Polymerases I and III: Structure and Assembly. Front. Mol. Biosci. 8, 680090 (2021). - PMC - PubMed
    1. White R. & Jackson S. The TATA-binding protein: a central role in transcription by RNA polymerases I, II and III. Trends Genet. 8, 284–288 (1992). - PubMed
    1. Gao Z., Herrera-Carrillo E. & Berkhout B. RNA Polymerase II Activity of Type 3 Pol III Promoters. Mol. Ther. - Nucleic Acids 12, 135–145 (2018). - PMC - PubMed
    1. Listerman I., Bledau A. S., Grishina I. & Neugebauer K. M. Extragenic Accumulation of RNA Polymerase II Enhances Transcription by RNA Polymerase III. PLoS Genet. 3, e212 (2007). - PMC - PubMed

Publication types