[Preprint]. 2024 Jun 6:2024.06.05.597676.
doi: 10.1101/2024.06.05.597676.

Whole-genome DNA methylomes of Tree shrew brains reveal conserved and divergent roles of DNA methylation on sex chromosome regulation

Affiliations

Whole-genome DNA methylomes of Tree shrew brains reveal conserved and divergent roles of DNA methylation on sex chromosome regulation

Dongmin Son et al. bioRxiv. .

Update in

Abstract

The tree shrew (Tupaia belangeri) is a promising emerging model organism in biomedical studies, notably due to their evolutionary proximity to primates. To enhance our understanding of how DNA methylation is implicated in regulation of gene expression and the X chromosome inactivation (XCI) in tree shrew brains, here we present their first genome-wide, single-base-resolution methylomes integrated with transcriptomes from prefrontal cortices. We discovered both divergent and conserved features of tree shrew DNA methylation compared to that of other mammals. DNA methylation levels of promoter and gene body regions are negatively correlated with gene expression, consistent with patterns in other mammalian brains studied. Comparing DNA methylation patterns of the female and male X chromosomes, we observed a clear and significant global reduction (hypomethylation) of DNA methylation across the entire X chromosome in females. Our data suggests that the female X hypomethylation does not directly contribute to the gene silencing of the inactivated X chromosome nor does it significantly drive sex-specific gene expression of tree shrews. However, we identified a putative regulatory region in the 5' end of the X inactive specific transcript (Xist) gene, a key gene for XCI, whose pattern of differential DNA methylation strongly relate to its differential expression between male and female tree shrews. We show that differential methylation of this region is conserved across different species. Moreover, we provide evidence suggesting that the observed difference between human and tree shrew X-linked promoter methylation is associated with the difference in genomic CpG contents. Our study offers novel information on genomic DNA methylation of tree shrews, as well as insights into the evolution of X chromosome regulation in mammals.

Keywords: DNA methylation; X chromosome; gene expression; tree shrew (Tupaia belangeri).


Figures

Figure 1.
Figure 1.
DNA methylomes of tree shrew and the correlation between DNA methylation and gene expression. Chromosomes 13 and 26 (1,001 genes) were excluded due to their unique patterns compared to other chromosomes. (A) Global (weighted) mean DNA methylation levels of CG, CHG, and CHH in each sample exhibit high levels of CpG methylation and low levels of CH methylation. (B) Mean (weighted) DNA methylation across gene bodies of 22,741 protein-coding genes in the autosomes and the X chromosome demonstrate decreases of DNA methylation near the transcription start sites. (C) Mean (weighted) DNA methylation of promoter, gene body, and intergenic regions in 20 groups of genes with different expression levels, ranging from rank 0 to rank20 (higher expressed genes from left to right). A negative correlation is observed in promoters, while a bell-shaped correlation is observed in gene bodies.
Figure 2.
Figure 2.
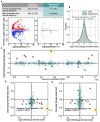
Global patterns of female X hypomethylation in the tree shrew PFC and its association with CpG counts. (A) Mean fractional DNA methylation levels of all CpGs in males and females demonstrates that the female X chromosome is globally hypomethylated compared to chromosome 8 and the male X chromosome. (B) Distributions of DNA methylation level differences of CpG sites between females and males in autosomes and the X chromosomes show that the X chromosome is generally hypomethylated. (C) The distribution of expression levels, promoter DNA methylation levels, and gene body DNA methylation levels of genes (1857 genes including both protein-coding genes and lncRNA genes) across the X chromosome in females (red) and males (blue). (D) The differences between females and males for expression, promoter methylation and gene body DNA methylation of genes across the X chromosome. The yellow dot in the gene expression plot represents the Xist gene, which is up-regulated in females. (E) Genes with female hypomethylated (mean 5mC male-female > 0.05, 1154 genes) promoters tend to have fewer CpGs compared to those with female hypermethylated (mean 5mC male-female < −0.05, 155 genes) promoters. (F) Comparisons of DNA methylation (Y-axis on the left) levels and their differences between males and females (Y-axis on the right) according to the numbers of CpGs in promoters (X-axis). Female promoters are clearly hypomethylated compared to male promoters when CpG counts are low. As CpG counts increases, both promoters are generally lowly methylated. Promoters with large CpG counts (>80) are on average female hypermethylated. (G) A comparison of promoter CpG O/E across three species (human, tree shrew and koala) demonstrates the similarity between the koala and the tree shrew compared to the human, specifically in the X-linked promoters.
Figure 3.
Figure 3.
Patterns of differential expression between males and females in relation to differential DNA methylation. Sex-specific expressed genes and their correlation with DNA methylation levels. (A) The MA plot illustrating differentially expressed genes across autosomes (left) and the X chromosome (right). Ashr-shrunken log fold-change values are used for the visualization. Blue dots represents male up-regulated genes and red dots represents female up-regulated genes. (B) The density distribution graph displays the log-transformed female-to-male expression ratio for genes. There was no significant difference between the X chromosome and autosomes (Mann-Whitney U test p-value = 0.13). (C) The distribution of female (red) and male (blue) up-regulated genes identified by DESeq2 across the X chromosome. The Xist gene is marked with a yellow box. (D, E) The Y-axis represents the difference in mean DNA methylation levels between females and males is across gene bodies (D) and promoters (E). The X-axis represents the log2 fold-change of female-to-male expression difference. Spearman’s rank correlation coefficient and p-value are reported.
Figure 4.
Figure 4.
DNA methylation difference between females and males for the newly annotated tree shrew Xist gene. (A) Longer transcripts are detected in female samples compared to male samples in the Xist gene region. (B) Fractional methylation levels of CpG sites around Xist are indicated and (C) the differences of DNA methylation levels of each CpG site between females and males are calculated. A CpG island near the 5’ end of the gene displays marked female hypomethylation. (D) The methylation levels at each CpG site are correlated with gene expression levels using six samples. The Y-axis values represent the significance of the Pearson correlation, with a red horizontal line indicating the threshold for a p-value of 0.05. The color gradients indicate their corresponding Pearson correlation coefficient, with red for a negative correlation and green for a positive correlation). Circular points represent female-hypomethylated CpGs, while diamond-shaped points indicate male-hypomethylated CpGs.
Figure 5.
Figure 5.
DNA methylation in the Y-linked contigs of the tree shrew PFC. (A) The distribution of the metric [1- (mean read-depth in females)/(mean read-depth in males)] for contigs. Three peaks are observed, which potentially correspond to from X-linked, autosome-linked, and Y-linked contigs. (B) Mean methylation levels for contigs in each peak. Notably, putatively X-linked contigs displayed female X hypomethylation. The numbers of contigs included in the sets are indicated. (C) (Left axis) The read-depth of cytosines in the CG context are visualized for male 1 and female 1 sample across each Y-linked contig. The contigs are sorted and connected create an adjusted position. (Right axis) The methylation levels of these contigs, compared with autosomes and the X chromosome. The Y-linked contigs exhibit markedly lower methylation levels than other chromosomes.

Similar articles

References

    1. Al Adhami H., Bardet A. F., Dumas M., Cleroux E., Guibert S., Fauque P., Acloque H., & Weber M. (2022). A comparative methylome analysis reveals conservation and divergence of DNA methylation patterns and functions in vertebrates. BMC Biology, 20(1), 70. 10.1186/s12915-022-01270-x - DOI - PMC - PubMed
    1. Beard C., Li E., & Jaenisch R. (1995). Loss of methylation activates Xist in somatic but not in embryonic cells. Genes & Development, 9(19), 2325–2334. 10.1101/gad.9.19.2325 - DOI - PubMed
    1. Brown C. J., Hendrich B. D., Rupert J. L., Lafrenière R. G., Xing Y., Lawrence J., & Willard H. F. (1992). The human XIST gene: Analysis of a 17 kb inactive X-specific RNA that contains conserved repeats and is highly localized within the nucleus. Cell, 71(3), 527–542. 10.1016/0092-8674(92)90520-m - DOI - PubMed
    1. Camacho C., Coulouris G., Avagyan V., Ma N., Papadopoulos J., Bealer K., & Madden T. L. (2009). BLAST+: Architecture and applications. BMC Bioinformatics, 10(1), 421. 10.1186/1471-2105-10-421 - DOI - PMC - PubMed
    1. Elango N., & Yi S. V. (2008). DNA Methylation and Structural and Functional Bimodality of Vertebrate Promoters. Molecular Biology and Evolution, 25(8), 1602–1608. 10.1093/molbev/msn110 - DOI - PubMed

Publication types