[Preprint]. 2024 Jun 6:2024.06.04.595773.
doi: 10.1101/2024.06.04.595773.

TYK2 as a novel therapeutic target in Alzheimer's Disease with TDP-43 inclusions

Affiliations

TYK2 as a novel therapeutic target in Alzheimer's Disease with TDP-43 inclusions

Laura E König et al. bioRxiv. .

Abstract

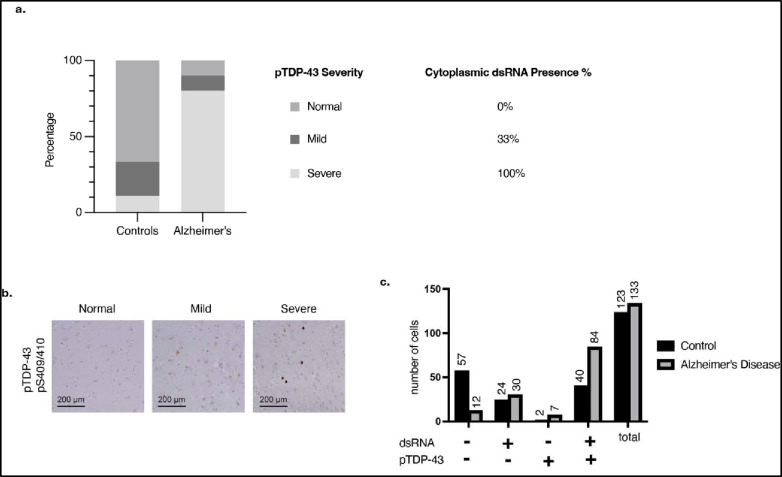
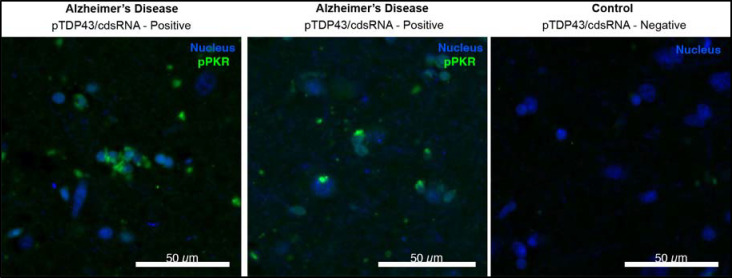
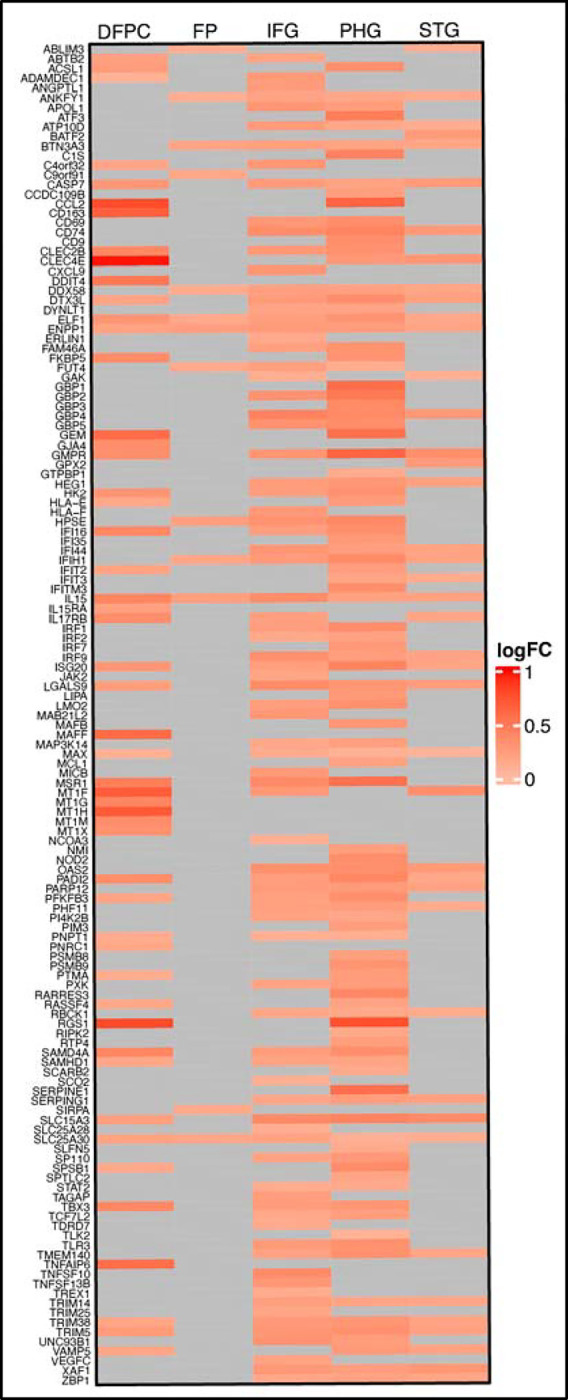
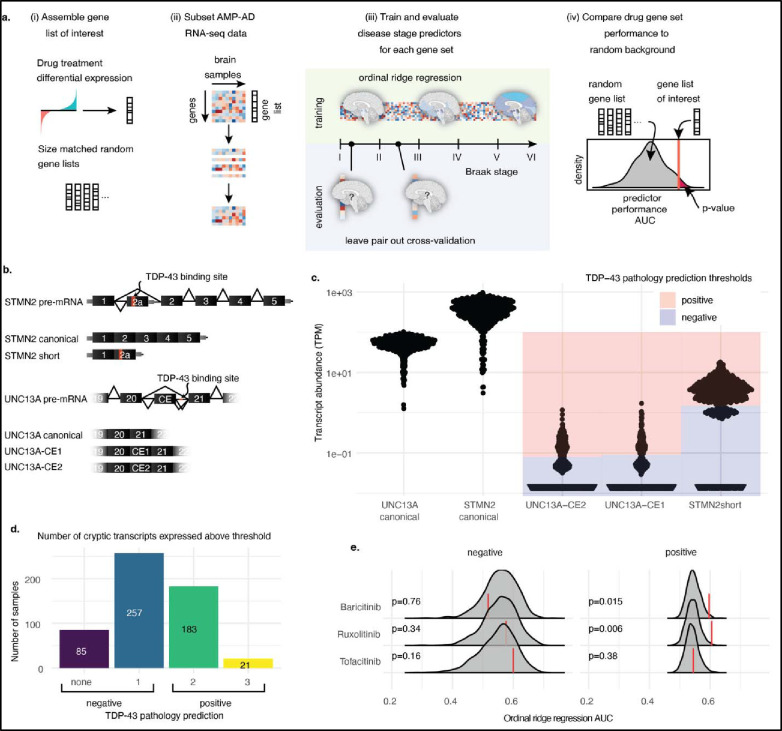
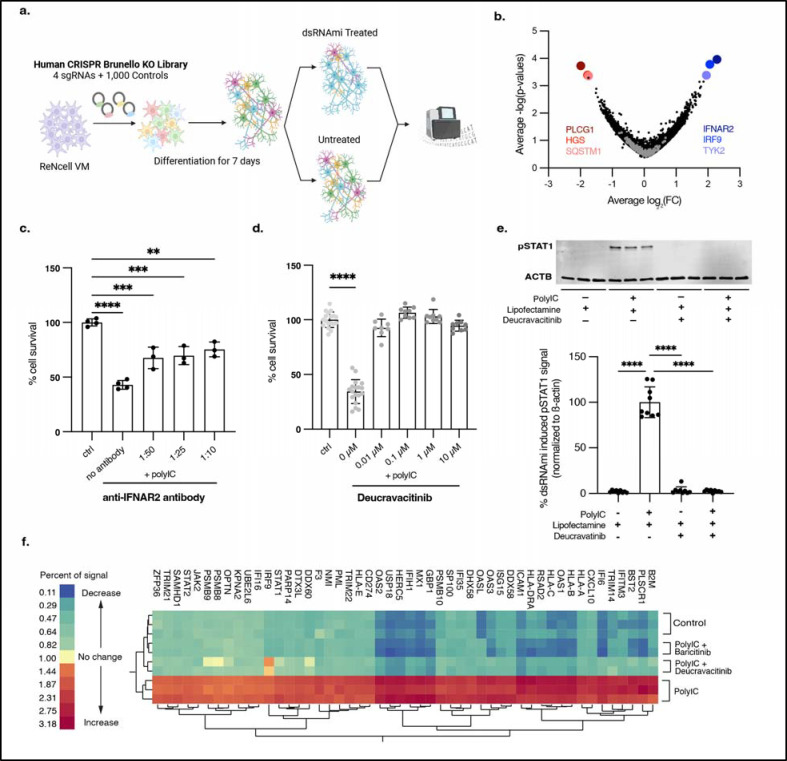
Neuroinflammation is a pathological feature of many neurodegenerative diseases, including Alzheimer's disease (AD)1,2 and amyotrophic lateral sclerosis (ALS)3, raising the possibility of common therapeutic targets. We previously established that cytoplasmic double-stranded RNA (cdsRNA) is spatially coincident with cytoplasmic pTDP-43 inclusions in neurons of patients with C9ORF72-mediated ALS4. CdsRNA triggers a type-I interferon (IFN-I)-based innate immune response in human neural cells, resulting in their death4. Here, we report that cdsRNA is also spatially coincident with pTDP-43 cytoplasmic inclusions in brain cells of patients with AD pathology and that type-I interferon response genes are significantly upregulated in brain regions affected by AD. We updated our machine-learning pipeline DRIAD-SP (Drug Repurposing In Alzheimer's Disease with Systems Pharmacology) to incorporate cryptic exon (CE) detection as a proxy of pTDP-43 inclusions and demonstrated that the FDA-approved JAK inhibitors baricitinib and ruxolitinib that block interferon signaling show a protective signal only in cortical brain regions expressing multiple CEs. Furthermore, the JAK family member TYK2 was a top hit in a CRISPR screen of cdsRNA-mediated death in differentiated human neural cells. The selective TYK2 inhibitor deucravacitinib, an FDA-approved drug for psoriasis, rescued toxicity elicited by cdsRNA. Finally, we identified CCL2, CXCL10, and IL-6 as candidate predictive biomarkers for cdsRNA-related neurodegenerative diseases. Together, we find parallel neuroinflammatory mechanisms between TDP-43 associated-AD and ALS and nominate TYK2 as a possible disease-modifying target of these incurable neurodegenerative diseases.


Conflict of interest statement

COMPETING INTERESTS M.W.A. is a consultant for TLL, LLC, Transposon Therapeutics, and has received in kind support from Eli Lilly that is not related to this work. A.S. is an employee at Flagship Labs 84, Inc., a subsidiary of Flagship Pioneering. F.P. is an employee of Merck Research Laboratories.

Figures

Extended Data Fig. 1:
Extended Data Fig. 1:. pTDP-43-severity and dsRNA presence in human postmortem brain sections.
a, Percentage of assessed FFPE sections (n = 10 with AD, n = 9 healthy controls) that show normal, mild, and severe pTDP-43 severity compared to healthy controls as well as the coincidence with dsRNA in percent of cases. b, Histological examples for the classification of pTDP-43 severity into normal, mild, and severe. c, Proportion of cells that stained for cdsRNA, pTDP-43, or both.
Extended Data Fig. 2:
Extended Data Fig. 2:. Phosphorylation of PKR as proof of the immunogenicity of cdsRNA.
Immunofluorescence staining of human postmortem brain sections of the amygdala comparing the phosphorylation of PKR (green) in pTDP-43/cdsRNA-positive AD (left and middle image) to a pTDP-43/cdsRNA-negative control (right image). Sytox Blue used to stain nuclei.
Extended Data Fig. 3:
Extended Data Fig. 3:. Upregulated ISGs within brain regions relevant in AD.
Heat map of RNA-sequencing data derived from the ROSMAP and MSBB databases comparing AD patients and healthy controls. Differential expression shown in log2 fold change (logFC) for pre-selected ISGs. DFPC: dorsolateral prefrontal cortex; FP: frontal pole; IFG: inferior frontal gyrus; PHG: parahippocampal gyrus; STG: superior temporal gyrus.
Extended Data Fig. 4:
Extended Data Fig. 4:. Prediction of drug efficacy in AD using DRIAD-SP.
Performances of three selected drugs in the DRIAD-SP prediction task. Drug efficacy was assessed according to the previously published protocol. Red lines indicate the DRIAD-SP model performance of the drug gene sets, whereas the gray shaded regions correspond to the distribution of model performances based on size-matched random gene sets.
Extended Data Fig. 5:
Extended Data Fig. 5:. Expression of TDP-43-associated transcripts in single neuronal nuclei.
Neuronal nuclei from ALS patients’ neocortical tissues were FACS-sorted by the presence of nuclear TDP-43 and NeuN. Here, we sorted the RNA-sequencing data obtained from the sorted nuclei for the presence of CEs as a proxy of TDP-43 pathology and thus absence of nuclear TDP-43. Each point corresponds to the abundance (transcripts per million; TPM) of TDP-43-associated CE transcripts or their canonical counterparts in one of the samples. (STMN2 short P < 0.0001; UNC13A-CE1 P = 0.0002; UNC13A-CE2 P = 0.0006; STMN2 P = 0.0017; UNC13A P = 0.11).
Extended Data Fig. 6:
Extended Data Fig. 6:. Comparison of CE transcript abundance between ROSMAP and MSBB datasets.
The proportion of samples with zero (red) and above zero (blue) abundance (transcripts per million; TPM) of the given transcripts is shown. MSBB samples had an appreciable lower abundance of UNC13A CE transcripts compared to ROSMAP samples. This difference can most likely be attributed to MSBB using single-end sequencing compared to the paired-end sequencing employed by ROSMAP, making determination of TDP-43 pathology in MSBB difficult.
Extended Data Fig. 7:
Extended Data Fig. 7:. Braak staging of TDP-43 cases and additional replicates for the prediction of drug efficacy through DRIAD-SP.
a, Comparison of Braak stage distribution of ROSMAP patient data (posterior cingulate cortex) relative to their predicted TDP-43 pathology. b, Performance of baricitinib, ruxolitinib and tofacitinib in DRIAD-SP as shown in Figure 2e, here including additional replicates of ruxolitinib and tofacitinib.
Extended Data Fig. 8:
Extended Data Fig. 8:. Schematic overview comparing our previously employed drug screening assay workflow and a new, refined workflow.
a, Graphical summary of main steps in drug screening assay according to our previous publication (“One Pot” Differentiation). b, New workflow including an additional step that comprises the differentiation of cells in a separate dish before being seeded into the final assay plate (“Separate Pot” Differentiation). This ensures less variability in the cell count per well and thus higher reproducibility with lower variance in the results.
Extended Data Fig. 9:
Extended Data Fig. 9:. Further validation of baricitinib and ruxolitinib in refined workflow as well as validation of IFNAR2 as a drug target.
a-b, Quantification of cell survival of ReN VM cell-derived neurons pre-treated with baricitinib (a) or ruxolitinib (b) at different concentrations (baricitinib: 0 μM P < 0.0001, n = 18; 0.01 μM P < 0.0001, n = 9; 0.1 μM P < 0.0001, n = 9; 1 μM P = 0.0872, n = 9; 10 μM P < 0.0001, n = 9; ruxolitinib: 0 μM P < 0.0001, n = 18; 0.01 μM P < 0.0001, n = 9; 0.1 μM P < 0.0001, n = 9; 1 μM P = 0.0016, n = 9; 10 μM P < 0.0001, n = 9) and afterwards transfected with poly(I:C) or lipofectamine as a vehicle control (ctrl, n = 18). Baricitinib: EC50 = 35.7 nM; ruxolitinib: EC50 = 47.7 nM. c-d, Image (top) and quantification (bottom) of Western blot of pSTAT1Y701 in ReN VM cell-derived neurons 24h after treatment with baricitinib (c) or ruxolitinib (d) and transfection with poly(I:C) normalized to the housekeeping protein beta actin (ACTB). Top: n = 3 per condition. Bottom: n = 9 per condition (all P < 0.0001). e, Quantification of cell survival of ReN VM cell-derived neurons treated with different doses of interferon-α (n = 3 per condition). The error bars represent the standard deviation.
Fig. 1:
Fig. 1:. CdsRNA induces IFN-I signaling and is spatially coincident with pTDP-43 inclusions in AD.
a, Immunohistochemistry (IHC) for cdsRNA and pTDP-43 inclusions in human postmortem brain sections of the amygdala. Top panel: healthy control cases, bottom panel: AD patient cases. Zoom-ins with 2x magnification. b, LHE, IHC and cyclic immunofluorescence (CyCIF) of human postmortem brain sections of the amygdala. IHC for cdsRNA, pTDP-43, tau, and Aß on different brain sections of the same healthy control (top panel, healthy control case II)/AD patient (bottom panel, AD case I). CyCIF panels show nuclei (Sytox Blue), Aß, dsRNA, pTDP-43, and tau as well as a merge of all channels. CyCIF was done on a single brain section of the same healthy control as the IHC images, but of a different AD patient. c, Pathway schematic of innate immune response to cdsRNA in AD leading to the expression of ISGs. d, Bubble chart of upregulated ISGs within relevant brain regions in AD patients. Each red bubble represents a gene. Bubble size is proportional to fold change of upregulation. Chart is based on a differential gene analysis of RNA-sequencing data derived from the ROSMAP and MSBB databases comparing AD patients and healthy controls. Individual gene names are shown in Extended Data Fig. 3. DFPC: dorsolateral prefrontal cortex; FP: frontal pole; IFG: inferior frontal gyrus; PHG: parahippocampal gyrus; STG: superior temporal gyrus. Patient information of human postmortem brain sections that are depicted in this figure can be found in Extended Data Table 1.
Fig. 2:
Fig. 2:. Prediction of drug efficacy in patients stratified by TDP-43 pathology.
a, Schematic representation of the DRIAD-SP drug efficacy prediction pipeline. From left to right (i) gene sets are assembled from differential gene expression analysis of cell lines treated with the drugs of interest against DMSO controls. For comparison, random gene sets matching the sizes of the drug gene sets are generated. (ii) RNA-sequencing data from AD brain samples is subset to only contain genes that are present in the gene set that is being tested. (iii) The RNA-sequencing subset is used to fit ordinal ridge regression models predicting Braak disease stage of the patient cohorts. Leave pair out cross-validation is used to evaluate model performance (areas under the curve; AUC). (iv) Drug efficacy is predicted by comparing the performance of the model using the drug gene sets to the size-matched random gene sets. b, Schematic representation of TDP-43 pathology associated splice variants that include CEs in STMN2 and UNC13A. c, Expression of TDP-43 associated splice variants in the PCC brain tissues of the ROSMAP patient cohort. Blue shaded regions are below, and red regions are above the chosen threshold for expression to be considered positive. d, Per-patient-quantification of the number of CE transcripts that are expressed above the chosen thresholds. Patients are predicted to be TDP-43 pathology negative if they express one or fewer of the CE transcripts, and positive if they express two or more. e, Performance of DRIAD-SP models for three selected drugs. Drug efficacy was assessed separately in patient populations according to their predicted TDP-43 pathology. Red lines indicate the DRIAD-SP model performance trained on the drug gene sets, whereas the gray shaded regions correspond to the distribution of model performances based on random gene sets.
Fig. 3:
Fig. 3:. CRISPR screen and subsequent validation identifies TYK2 as a therapeutic target.
a, Schematic of the CRISPR screen conducted in ReN VM cells using the Brunello library to identify potential therapeutic targets for rescuing the toxic immune response triggered by cdsRNA. b, Volcano plot showing the LFC of genes targeted in the CRISPR screen against their −log(P-value) and identifying IFNAR2 (average LFC = 2.23825, P = 0.0001), IRF9 (average LFC = 2.0625, P = 0.0002) and TYK2 (average LFC = 1.95, P = 0.0004) as the most prominent and PLCG1 (average LFC = −1.9875, P = 0.0002), HGS (average LFC = −1.775, P = 0.0004) and SQSTM1 (average LFC = −1.7475, P = 0.0005) as the least abundant knockouts. Gray dots represent negative control sgRNAs. c, Quantification of cell survival of ReN VM cell-derived neurons treated with different concentrations (no antibody P < 0.0001, n=4; 1:50 P = 0.0001, n = 3; 1:25 P = 0.0002, n = 3; 1:10 P = 0.0011, n = 3) of anti-IFNAR2 antibody after transfection with poly(I:C) or lipofectamine as vehicle control (ctrl, n = 4). d, Quantification of cell survival of ReN VM cell-derived neurons pre-treated with deucravacitinib, a selective TYK2 inhibitor, at different concentrations (0 μM P < 0.0001, n = 18; 0.01 μM P = 0.1273, n = 9; 0.1 μM P = 0.1920, n = 9; 1 μM P = 0.8455, n = 9; 10 μM P = 0.3562, n = 9) and afterwards transfected with poly(I:C) or lipofectamine as a vehicle control (ctrl, n = 18). e, Image (top) and quantification (bottom) of Western blot of pSTAT1Y701 in ReN VM cell-derived neurons 24h after treatment with deucravacitinib and transfection with poly(I:C) normalized to the housekeeping protein beta actin (ACTB). Top: n = 3 per condition. Bottom: n = 9 per condition (all P < 0.0001). f, Two-way hierarchical clustering of relative protein abundance of IFN-I-related proteins acquired through 10-plex mass spectrometry. Control = lipofectamine (vehicle control). Conditions with drug: n = 2, conditions without drug: n = 3. All replicates in this figure are biological replicates. The error bars represent the standard deviation.
Fig. 4:
Fig. 4:. Inflammatory biomarkers for cdsRNA-positive AD.
a-c, CCL2 (a), CXCL10 (b), and IL6 (c) concentration in pg/mL in the media of ReN VM cell-derived neurons treated with baricitinib, ruxolitinib, or deucravacitinib and transfected with poly(I:C) (n=3 per condition; P < 0.0001 in all conditions). d, Schematic overview of hypothesized pathomechanisms underlying cdsRNA in neurodegenerative diseases. The error bars represent the standard error of the mean.

References

MAIN REFERENCES

    1. Chen X. & Holtzman D. M. Emerging roles of innate and adaptive immunity in Alzheimer’s disease. Immunity 55, 2236–2254 (2022). - PMC - PubMed
    1. Hansen D. V., Hanson J. E. & Sheng M. Microglia in Alzheimer’s disease. J Cell Biol 217, 459 (2018). - PMC - PubMed
    1. Mead R. J., Shan N., Reiser H. J., Marshall F. & Shaw P. J. Amyotrophic lateral sclerosis: a neurodegenerative disorder poised for successful therapeutic translation. Nature Reviews Drug Discovery 2022 22:3 22, 185–212 (2022). - PMC - PubMed
    1. Rodriguez S. et al. Genome-encoded cytoplasmic double-stranded RNAs, found in C9ORF72 ALS-FTD brain, propagate neuronal loss. Sci Transl Med 13, (2021). - PMC - PubMed
    1. Palmer A. C. & Sorger P. K. Combination Cancer Therapy Can Confer Benefit via Patient-to-Patient Variability without Drug Additivity or Synergy. Cell 171, 1678–1691.e13 (2017). - PMC - PubMed

METHODS REFERENCES

    1. Bihlmeyer N. A. et al. Novel methods for integration and visualization of genomics and genetics data in Alzheimer’s disease. Alzheimers Dement 15, 788 (2019). - PMC - PubMed
    1. Song Y. et al. A dynamic view of the proteomic landscape during differentiation of ReNcell VM cells, an immortalized human neural progenitor line. Scientific Data 2019 6:1 6, 1–17 (2019). - PMC - PubMed
    1. Patro R., Duggal G., Love M. I., Irizarry R. A. & Kingsford C. Salmon provides fast and bias-aware quantification of transcript expression. Nature Methods 2017 14:4 14, 417–419 (2017). - PMC - PubMed
    1. Soneson C., Love M. I. & Robinson M. D. Differential analyses for RNA-seq: transcript-level estimates improve gene-level inferences. F1000Research 2016 4:1521 4, 1521 (2016). - PMC - PubMed
    1. Airola A., Pahikkala T., Waegeman W., De Baets B. & Salakoski T. An experimental comparison of cross-validation techniques for estimating the area under the ROC curve. Comput Stat Data Anal 55, 1828–1844 (2011).

Publication types

LinkOut - more resources