[Preprint]. 2024 Jun 9:2024.06.07.597806.
doi: 10.1101/2024.06.07.597806.

BMAL1-HIF2α heterodimers contribute to ccRCC

Affiliations

BMAL1-HIF2α heterodimers contribute to ccRCC

Rebecca M Mello et al. bioRxiv. .

Abstract

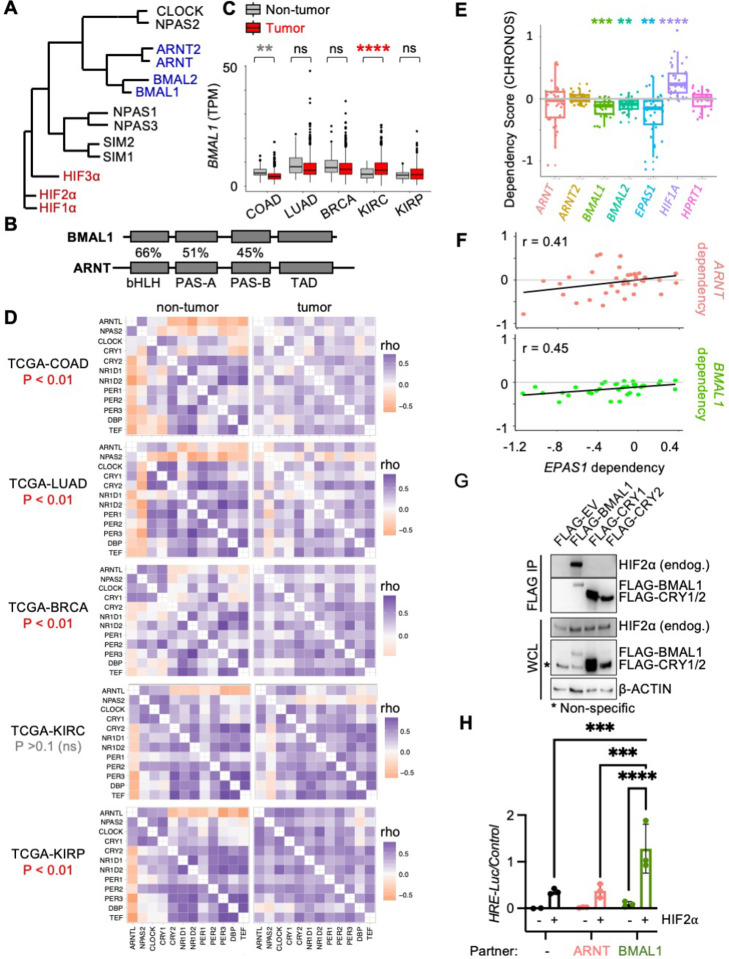
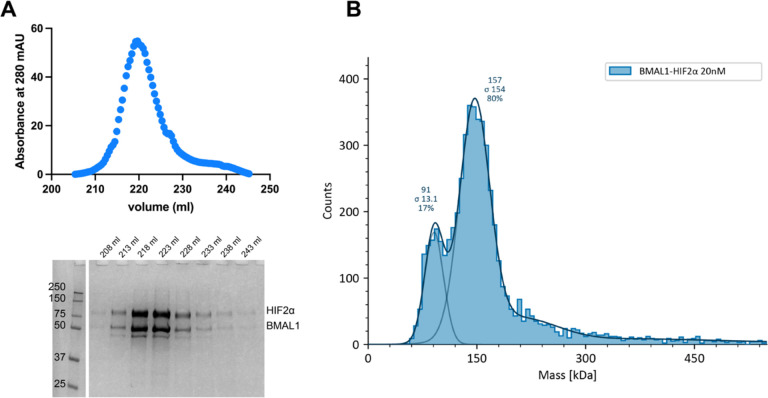
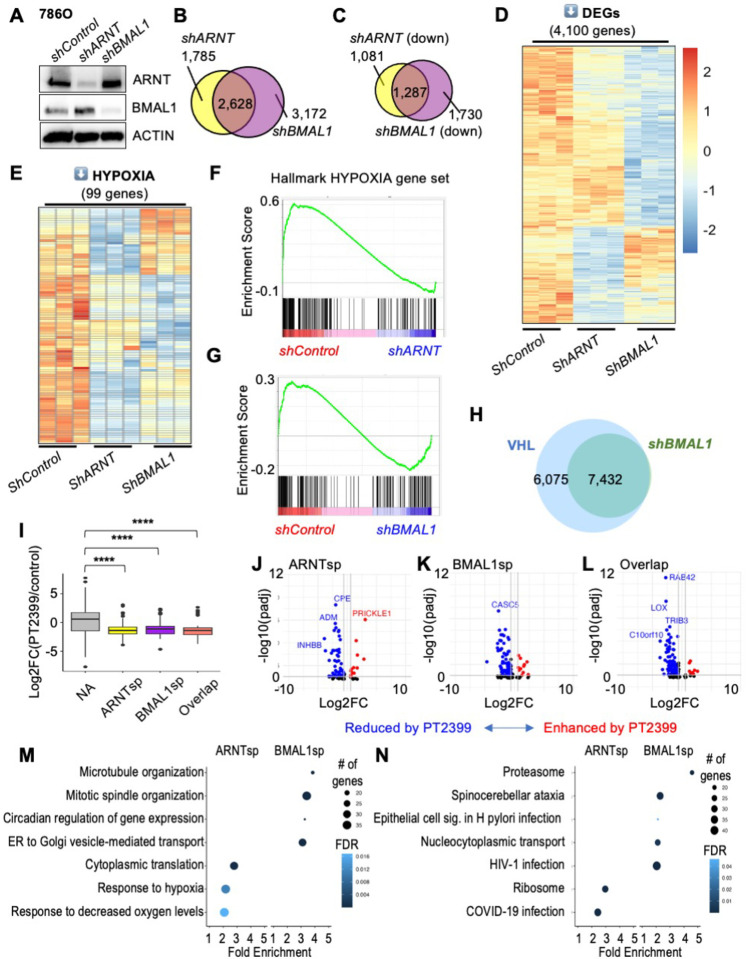
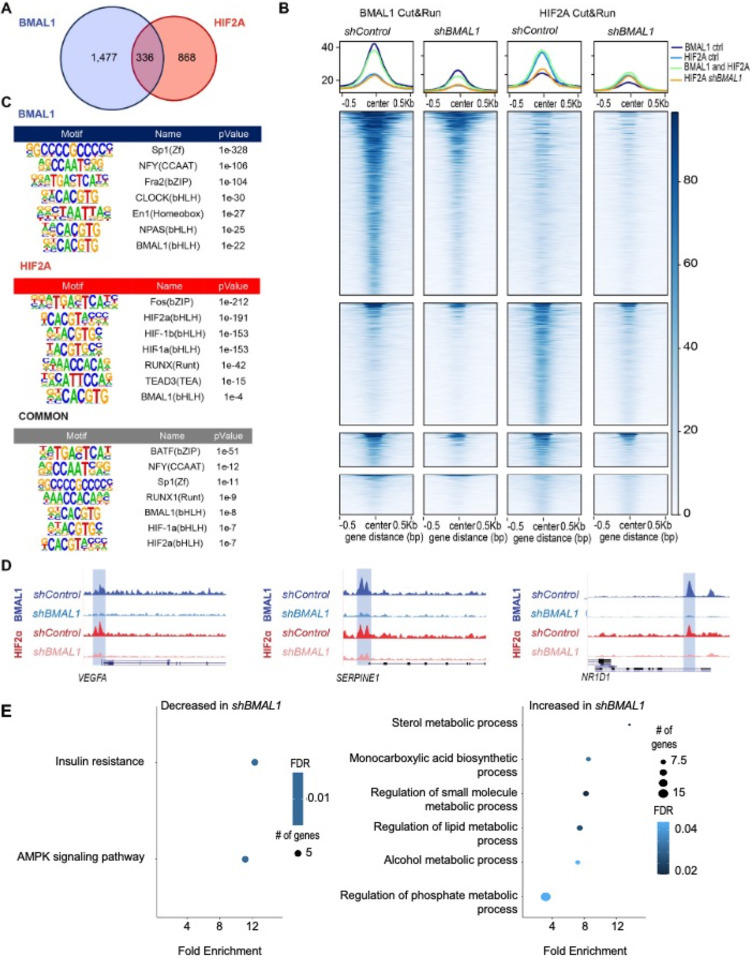
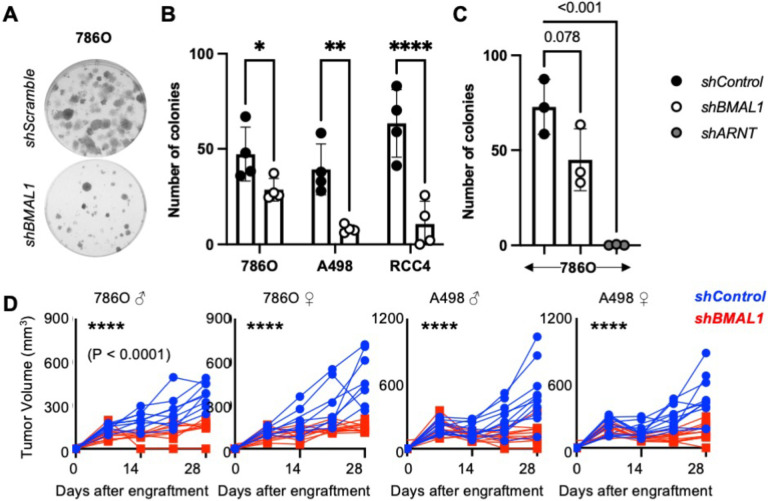
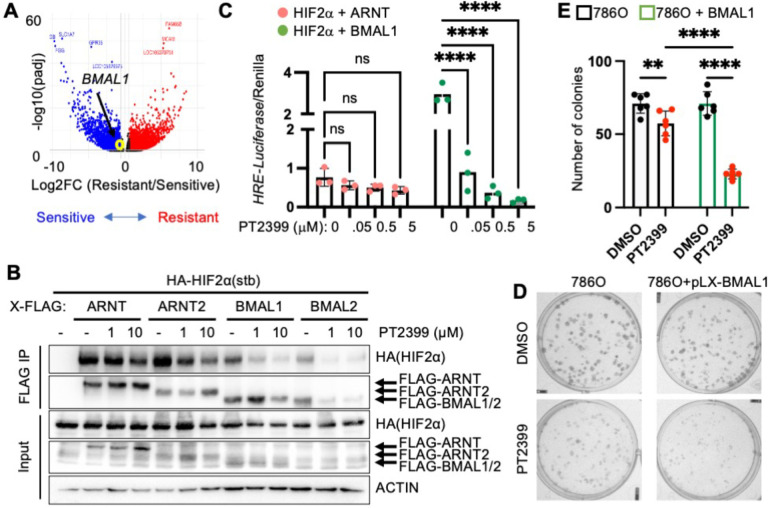
Circadian disruption enhances cancer risk, and many tumors exhibit disordered circadian gene expression. We show rhythmic gene expression is unexpectedly robust in clear cell renal cell carcinoma (ccRCC). Furthermore, the clock gene BMAL1 is higher in ccRCC than in healthy kidneys, unlike in other tumor types. BMAL1 is closely related to ARNT, and we show that BMAL1-HIF2α regulates a subset of HIF2α target genes in ccRCC cells. Depletion of BMAL1 reprograms HIF2α chromatin association and target gene expression and reduces ccRCC growth in culture and in xenografts. Analysis of pre-existing data reveals higher BMAL1 in patient-derived xenografts that are sensitive to growth suppression by a HIF2α antagonist (PT2399). We show that BMAL1-HIF2α is more sensitive than ARNT-HIF2α to suppression by PT2399, and increasing BMAL1 sensitizes 786O cells to growth inhibition by PT2399. Together, these findings indicate that an alternate HIF2α heterodimer containing the circadian partner BMAL1 contributes to HIF2α activity, growth, and sensitivity to HIF2α antagonist drugs in ccRCC cells.


Conflict of interest statement

Competing interests The authors declare no competing interests.

Figures

Figure. 1.
Figure. 1.. BMAL1 forms an active heterodimer with HIF2a.
(A) Phylogenetic tree for bHLH-PAS proteins. (B) Percent sequence identity for bHLH and PAS domains in BMAL1 and ARNT. (C,D) Detection of BMAL1 (transcripts per million, TPM) (C) and clock correlation distance (CCD) heatmaps (D) calculated from RNA sequencing data from tumors and adjacent normal tissues in cancer genome atlas projects: colorectal adenocarcinoma (COAD), lung adenocarcinoma (LUAD), breast cancer (BRCA), kidney clear cell renal cell carcinoma (KIRC), and renal papillary cancinoma (KIRP). (E,F) Dependency (CHRONOS) scores (E) and correlations thereof (F) for bHLH-PAS members in RCC cell lines from DepMap ,. (G) Detection of indicated proteins in whole cell extracts (input) or following immunoprecipitation of the FLAG tag from 786O cells transiently expressing the indicated plasmids. (H) Relative luciferase units detected from U2OS cells expressing HRE-Luciferase and additional indicated plasmids with (red) or without (black) exogenous stabilized HIF2α (P405A, P531A, N837A). In (C,E) boxplots depict the median and interquartile range (IQR), whiskers extend either to the minimum or maximum data point or 1.5*IQR beyond the box, whichever is shorter. Outliers (values beyond the whisker) are shown as dots in (C). In (H) bars represent mean ± s.e.m. for three experimental replicates and symbols represent the mean of n=5 measurements for each experiment. In (C,E,H) ** Padj < 0.01, *** P< 0.001, **** P < 0.0001 by two-way ANOVA with Tukey’s (C,E) or Sidak’s (H) correction for multiple comparison.
Figure 2:
Figure 2:. Purified BMAL1 and HIF2a form a stable complex in vitro.
(A) Heparin chromatography elution of BMAL1 and HIF2a co-expressed in insect cells. SDS-PAGE analysis shows a co-eluted stoichiometric complex of BMAL1-HIF2a. (B) Mass photometry of purified BMAL1-HIF2a complex. A minor peak centered at 91 kDa corresponds to the molecular weight of HIF2a, suggesting that it is in slight excess. The major peak, centered at 157 kDa, is consistent with the calculated molecular weight for the BMAL1-HIF2a heterodimer.
Figure 3.
Figure 3.. Endogenous BMAL1 contributes to HIF2α target gene expression in RCC cells.
(A) Detection of ARNT, BMAL1, and ACTIN by immunoblot in 786O cells expressing the indicated shRNAs. (B-E) Venn diagrams (B,C) and heatmaps (D,E) depicting all differentially expressed genes (DEGs) (B), significantly downregulated genes (C,D) or downregulated genes in the Hallmark HYPOXIA gene set (E) in 786O cells expressing the indicated shRNAs. DEGs were identified using DESeq2 with a false discovery rate (FDR) cutoff of 0.1. (F,G) Enrichment plots showing the impact of shARNT (F) or shBMAL1 (G) on genes in the Hallmark HYPOXIA gene set. (H) Venn diagram depicting overlap of DEGs in 786O cells expressing VHL (WT8 cells) or expressing shBMAL1. (I) Boxplot depicting changes in gene expression in PDXs treated with PT2399 (data from including sensitive PDXs only) for genes grouped by whether their expression in 786O cells is decreased by shARNT and not by shBMAL1 (ARNTsp, yellow), by shBMAL1 and not by shARNT (BMAL1sp, purple), by either shARNT or shBMAL1 (Overlap, salmon), or neither (NA, gray). **** P < 0.0001 by two-way ANOVA with Tukey’s correction. Boxes depict the median and interquartile range (IQR), whiskers extend either to the minimum or maximum data point or 1.5*IQR beyond the box, whichever is shorter. Outliers (values beyond the whisker) are shown as dots. (J-L) Volcano plots depicting expression changes for individual genes in groups depicted in (I). Genes with padj < 0.05 are colored in red (fold change > 1.5) or blue (fold change < 0.67). (M,N) Top non-redundant GOBP (M) or KEGG (N) pathways with ≥ 15 genes, FDR < 0.05, fold enrichment ≥ 2 enriched among ARNT-specific or BMAL1-specific target genes in 786O cells.
Figure 4.
Figure 4.. BMAL1 influences recruitment of HIF2α to a subset of target genes.
(A) Venn diagram depicting the numbers of genomic sites (“peaks”) identified in chromatin fragments isolated by CUT&RUN procedure from 786O cells using antibodies recognizing BMAL1 (blue) or HIF2α (red). (B) Chromatin binding profiles of BMAL1 and HIF2α in CUT&RUN samples (n=3 per condition) prepared from 786O cells expressing the indicated shRNAs. Peaks are depicted in four groups: BMAL1 peaks in 786O cells expressing shControl (top row: 1,813 peaks), HIF2α peaks in 786O cells expressing shControl (second row: 1,207 peaks), peaks associated with both BMAL1 and HIF2α in 786O cells expressing shControl (third row: 336 peaks), or HIF2α peaks identified only in 786O cells expressing shBMAL1 (bottom row: 393 peaks). (C) Transcription factor binding motifs enriched in chromatin associated with BMAL1, HIF2α, or both (common) in shControl cells. (D) Representative genome browser tracks for BMAL1 and HIF2α CUT&RUN in 786O cells expressing shControl or shBMAL1, showing peaks in VEGFA, SERPINE1, and NR1D1 loci. Data represent merged read counts for triplicate samples for each condition. (E,F) Combined KEGG and GOBP pathways enriched (≥ 5 genes, FDR < 0.05, fold enrichment > 1.5) in genes located near peaks identified in both BMAL1 and HIF2α CUT&RUN samples (336 common peaks) and exhibiting significantly decreased (E, 1,730 genes) or increased (F, 1,442 genes) expression in 786O cells expressing shBMAL1. This analysis integrates CUT&RUN data with RNA sequencing data described in Figure 3.
Figure 5.
Figure 5.. Depletion of BMAL1 suppresses growth in RCC cells and tumors.
(A-C) Representative images (A) and quantification (B,C) of colonies stained with crystal violet 10–16 days after plating 250 cells expressing the indicated plasmids per well. Data represent the mean ± s.d. for 3–4 wells per condition. * P < 0.05, ** P < 0.01, *** P < 0.001 by two-way ANOVA with Tukey’s correction for multiple hypothesis testing. (D) Volume of xenograft tumors grown in flanks of male or female NIH-III Nude mice from implanted 786O or A498 cells expressing indicated shRNAs. Weekly measurements of individual tumor volumes are shown. **** P < 0.0001 for shBMAL1 vs shControl by repeated measures ANOVA.
Figure 6.
Figure 6.. BMAL1 promotes sensitivity to PT2399.
(A) Volcano plot depicting differentially expressed genes in patient-derived xenografts that were sensitive or resistant to growth suppression by PT2399 in . Genes with padj < 0.05 are colored in red (FC > 1.5) or blue (FC < 0.67) . (B) Detection of indicated proteins in cell extracts (input) or following immunoprecipitation of the FLAG tag from HEK293 cells transiently expressing indicated plasmids HIF2α(stb): stabilized HIF2α (P405A, P531A, N837A) and treated with 10 μM MG132 for 4 hours and indicated concentrations of PT2399 for 1 hour. (C) Relative luciferase units detected from U2OS cells expressing HRE-Luciferase and additional indicated plasmids and treated with PT2399 at indicated concentrations for 16 hours. P < 0.0001 for interaction between bHLH partner and PT2399 treatment. (D,E) Representative images (D) and quantification (E) of colonies stained with crystal violet 10–16 days after plating 250 cells expressing the indicated plasmids per well in media containing vehicle (DMSO, black circles) or 5 μM PT2399 (red circles). Bars with black and green outlines represent 786O cells with or without overexpression of BMAL1, respectively. In (C) bars represent mean ± s.d. for three independent experiments and symbols represent the mean of n=5 measurements for each experiment. Data in (E) represent the mean ± s.d. for 3–6 samples per condition from one experiment representative of at least three replicates. ** P < 0.01, **** P < 0.0001 by two-way ANOVA with Sidak’s (C) or Tukey’s (E) correction for multiple hypothesis testing.

Similar articles

References

    1. Shilts J., Chen G. & Hughey J. J. Evidence for widespread dysregulation of circadian clock progression in human cancer. PeerJ 6, e4327 (2018). 10.7717/peerj.4327 - DOI - PMC - PubMed
    1. Papagiannakopoulos T. et al. Circadian Rhythm Disruption Promotes Lung Tumorigenesis. Cell metabolism (2016). 10.1016/j.cmet.2016.07.001 - DOI - PMC - PubMed
    1. Chun S. K. et al. Disruption of the circadian clock drives Apc loss of heterozygosity to accelerate colorectal cancer. Sci Adv 8, eabo2389 (2022). 10.1126/sciadv.abo2389 - DOI - PMC - PubMed
    1. Dong Z. et al. Targeting Glioblastoma Stem Cells through Disruption of the Circadian Clock. Cancer Discov 9, 1556–1573 (2019). 10.1158/2159-8290.CD-19-0215 - DOI - PMC - PubMed
    1. Linehan W. M. & Ricketts C. J. The Cancer Genome Atlas of renal cell carcinoma: findings and clinical implications. Nature reviews. Urology 16, 539–552 (2019). 10.1038/s41585-019-0211-5 - DOI - PubMed

Publication types